Community Tip - Visit the PTCooler (the community lounge) to get to know your fellow community members and check out some of Dale's Friday Humor posts! X
- Subscribe to RSS Feed
- Mark Topic as New
- Mark Topic as Read
- Float this Topic for Current User
- Bookmark
- Subscribe
- Mute
- Printer Friendly Page
Unknown beautiful chart types: can you recognize which software they were done from?
- Mark as New
- Bookmark
- Subscribe
- Mute
- Subscribe to RSS Feed
- Permalink
- Notify Moderator
Unknown beautiful chart types: can you recognize which software they were done from?
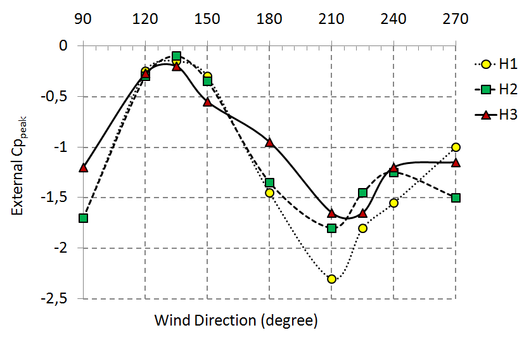
Can someone recognize these types of charts and which software they were done from? Are these from Mathcad Prime or Matlab or any other software you may know of? Can these be done in Mathcad Prime 3 aswell?
- Labels:
-
Other
- Mark as New
- Bookmark
- Subscribe
- Mute
- Subscribe to RSS Feed
- Permalink
- Notify Moderator
Mathcad 15 allow to do so:
However, the second chart (chart2) is 100% composite.
- Tags:
- mathcad 15
- Mark as New
- Bookmark
- Subscribe
- Mute
- Subscribe to RSS Feed
- Permalink
- Notify Moderator
I don't know how they were made. But an excellent (if a bit complicated) graphing program is GNU R - that could make them all. It has all sorts of capabilities - although you do have download extensions for certain capabilities. But it's free.
- Mark as New
- Bookmark
- Subscribe
- Mute
- Subscribe to RSS Feed
- Permalink
- Notify Moderator
- Mark as New
- Bookmark
- Subscribe
- Mute
- Subscribe to RSS Feed
- Permalink
- Notify Moderator
All these diagrams can be executed Excel
- Tags:
- excel
- Mark as New
- Bookmark
- Subscribe
- Mute
- Subscribe to RSS Feed
- Permalink
- Notify Moderator
without specific example or images of the charts you are referring to, it is difficult to determine which software was used to create them. Many software tools, including Mathcad Prime and MATLAB, offer a wide range of charting capabilities, allowing users to create various types of charts such as line graphs, bar charts, scatter plots, pie charts, etc.
Mathcad Prime is primarily a computational tool that allows you to perform mathematical calculations and create mathematical documents, but it may also have some charting capabilities. MATLAB, on the other hand, is a programming and numerical computing software that provides extensive charting and visualization capabilities.
To determine if a specific type of chart can be created in Mathcad Prime 3, you would need to consult the software documentation or explore its available charting features and options.


