Community Tip - Did you get an answer that solved your problem? Please mark it as an Accepted Solution so others with the same problem can find the answer easily. X
- Subscribe to RSS Feed
- Mark Topic as New
- Mark Topic as Read
- Float this Topic for Current User
- Bookmark
- Subscribe
- Mute
- Printer Friendly Page
graph
- Mark as New
- Bookmark
- Subscribe
- Mute
- Subscribe to RSS Feed
- Permalink
- Notify Moderator
graph
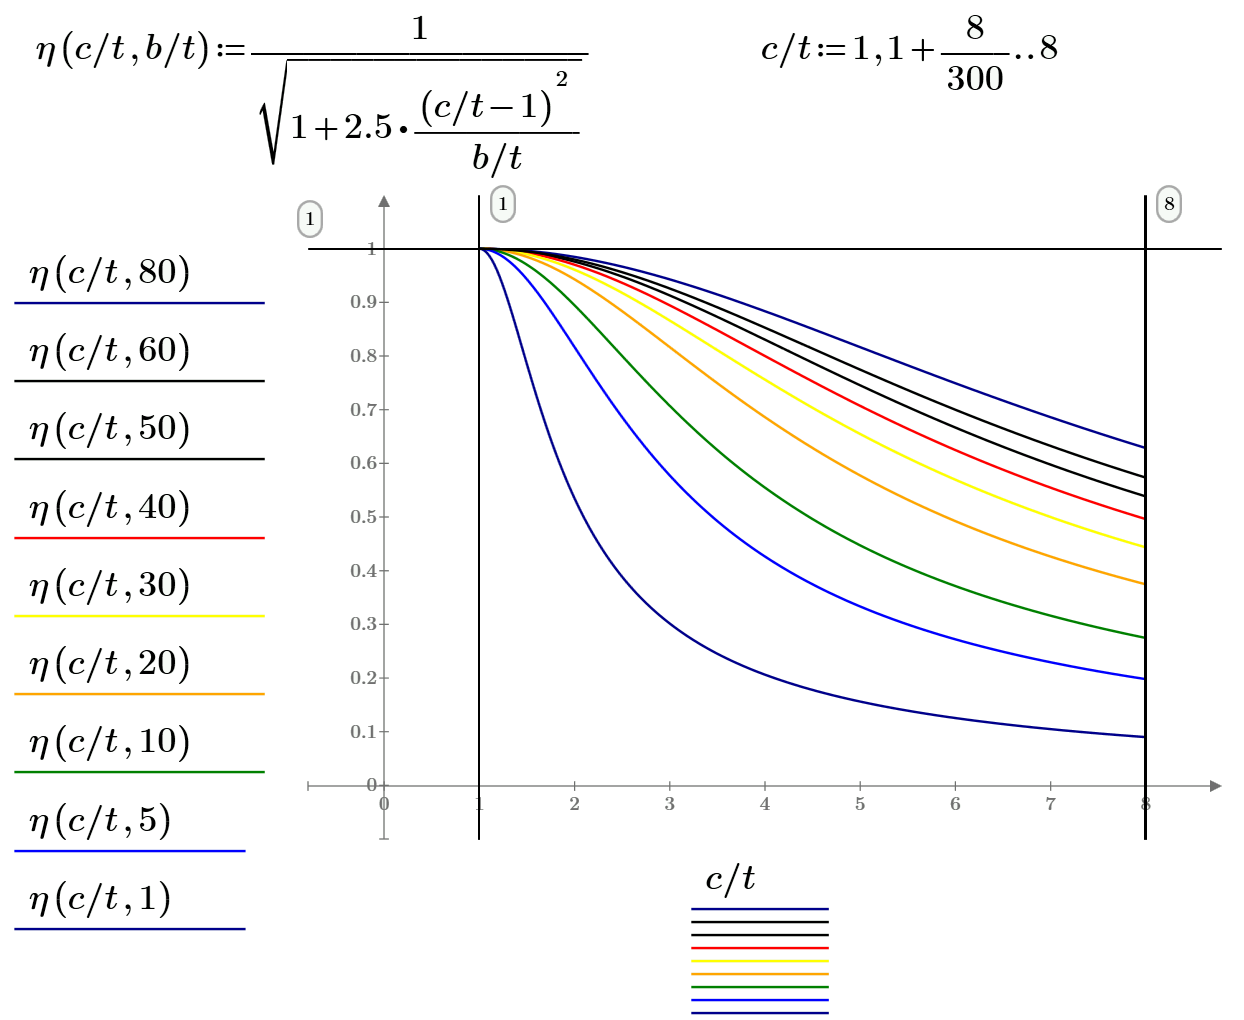
Hi. How can I make the graph in Mathcad prime similar to this figure. Do I have a missing formula ?

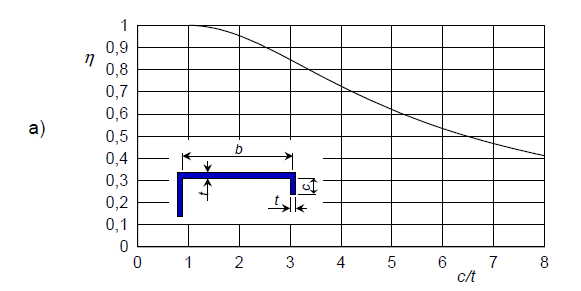
Solved! Go to Solution.
- Labels:
-
Other
Accepted Solutions
- Mark as New
- Bookmark
- Subscribe
- Mute
- Subscribe to RSS Feed
- Permalink
- Notify Moderator
Lex Dante wrote:
I have here a graph where grid line are not symmetrical. Are this possible to create using Mathcad prime ?
Yes, its possible!
Regards
Werner
- Mark as New
- Bookmark
- Subscribe
- Mute
- Subscribe to RSS Feed
- Permalink
- Notify Moderator
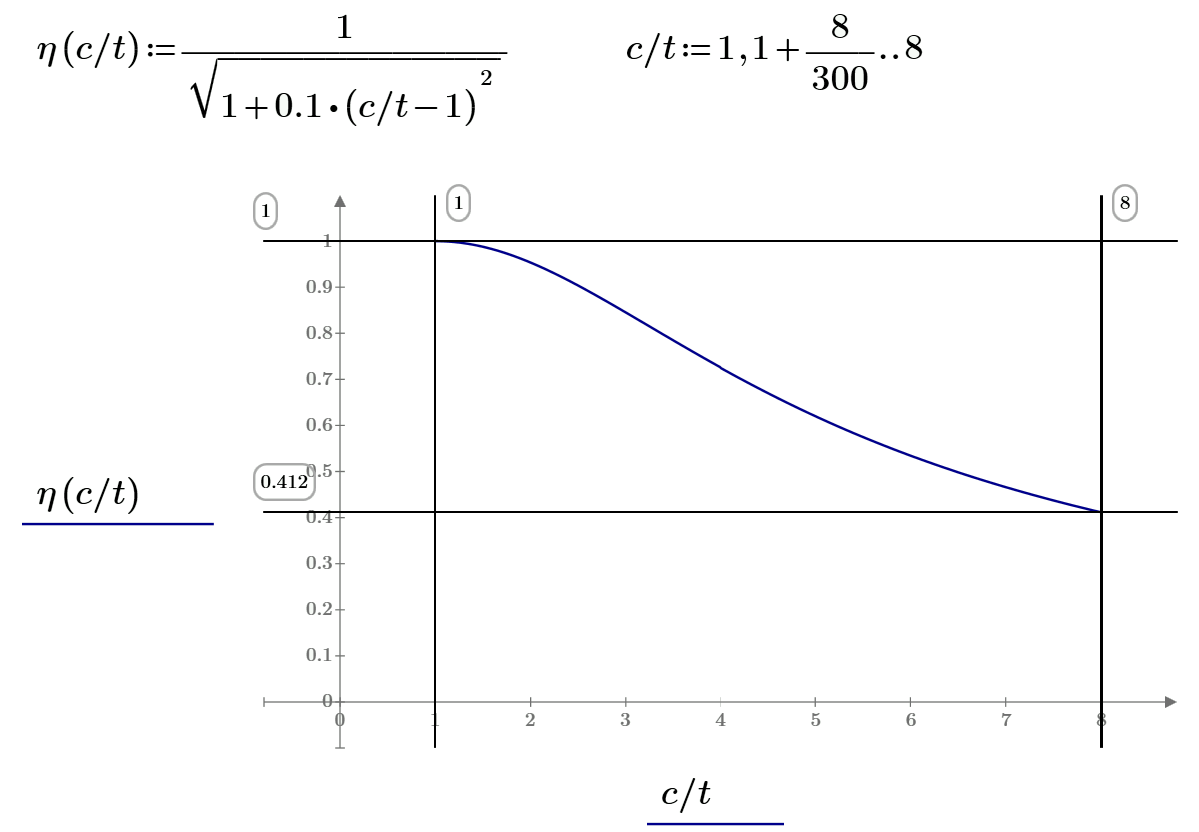
See please the picture and Mathcad Prime 3 sheet in attach!
Do you need grid?
- Mark as New
- Bookmark
- Subscribe
- Mute
- Subscribe to RSS Feed
- Permalink
- Notify Moderator
thanks
- Mark as New
- Bookmark
- Subscribe
- Mute
- Subscribe to RSS Feed
- Permalink
- Notify Moderator
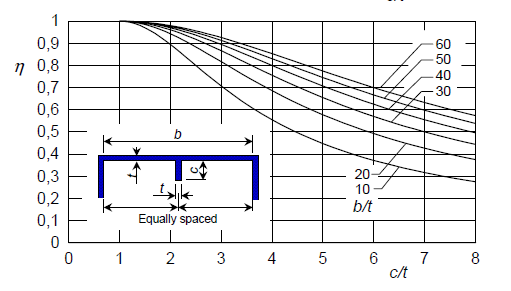
I appreciated your help . Can you please help me bout this one also

- Mark as New
- Bookmark
- Subscribe
- Mute
- Subscribe to RSS Feed
- Permalink
- Notify Moderator
- Mark as New
- Bookmark
- Subscribe
- Mute
- Subscribe to RSS Feed
- Permalink
- Notify Moderator
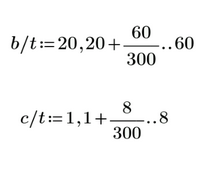
Hello Valery,
How do you know in which points Mathcad should evaluate the function?
How do you know that this is the correct series?
- Mark as New
- Bookmark
- Subscribe
- Mute
- Subscribe to RSS Feed
- Permalink
- Notify Moderator
Ruben Alejandro Villarreal Barrios wrote:
Hello Valery,
How do you know in which points Mathcad should evaluate the function?
How do you know that this is the correct series?
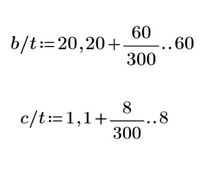
300 points is enough for... me. But we can use 700 or others... fine (luck) numbers.
See 1, 3, 7, 11, 21 etc
Sorry, more correct
- Mark as New
- Bookmark
- Subscribe
- Mute
- Subscribe to RSS Feed
- Permalink
- Notify Moderator
Valery Ochkov wrote:
Ruben Alejandro Villarreal Barrios wrote:
Hello Valery,
How do you know in which points Mathcad should evaluate the function?
How do you know that this is the correct series?
300 points is enough for... me.
So it should be rather 40/300 and 7/300 to get 301 points for each graph.
WE
- Mark as New
- Bookmark
- Subscribe
- Mute
- Subscribe to RSS Feed
- Permalink
- Notify Moderator
I got it. Thank you!
Another 5 min question, Is there a way to see the domain of this function? We already know (in the first graph) that the function will exist between 0..8, but what about if we don't have this range and we want to know the domain without graphing the entire function, is there a way to do that in Mathcad?
- Mark as New
- Bookmark
- Subscribe
- Mute
- Subscribe to RSS Feed
- Permalink
- Notify Moderator
Is this correct . is there any simplified method of this case ?


- Mark as New
- Bookmark
- Subscribe
- Mute
- Subscribe to RSS Feed
- Permalink
- Notify Moderator
- Mark as New
- Bookmark
- Subscribe
- Mute
- Subscribe to RSS Feed
- Permalink
- Notify Moderator
thank you once again.![]()
- Mark as New
- Bookmark
- Subscribe
- Mute
- Subscribe to RSS Feed
- Permalink
- Notify Moderator
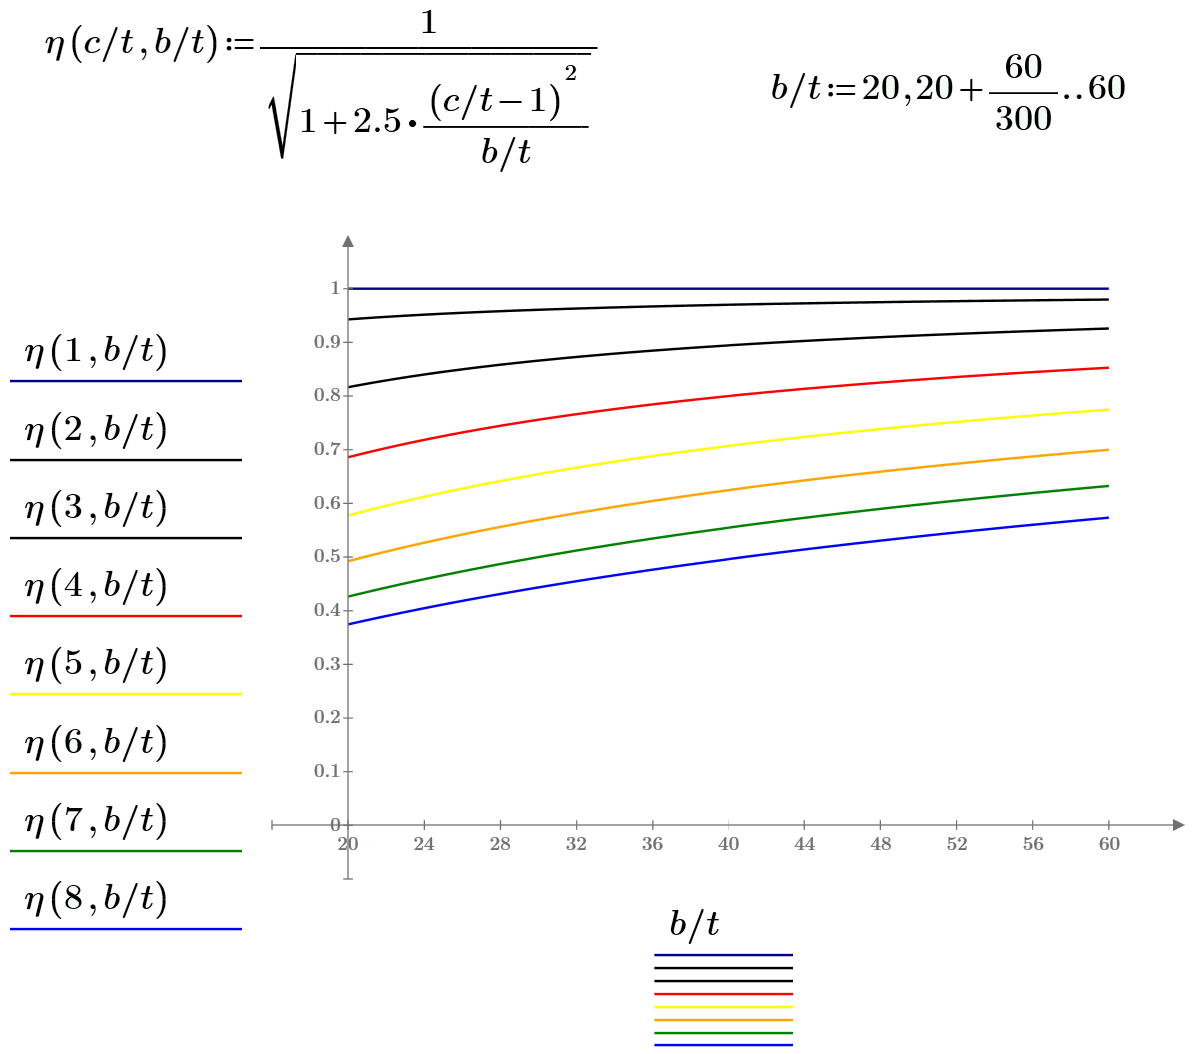
One more graph
- Mark as New
- Bookmark
- Subscribe
- Mute
- Subscribe to RSS Feed
- Permalink
- Notify Moderator
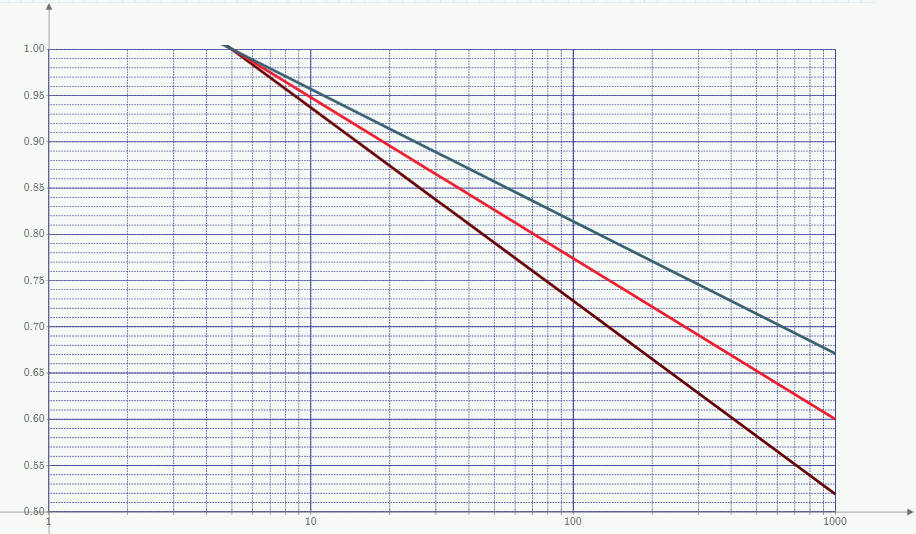
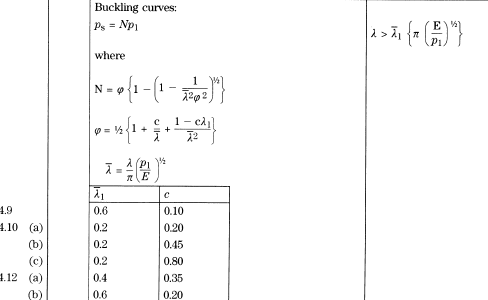
in similar principle why I cannot do this in this graph ?

- Mark as New
- Bookmark
- Subscribe
- Mute
- Subscribe to RSS Feed
- Permalink
- Notify Moderator
- Mark as New
- Bookmark
- Subscribe
- Mute
- Subscribe to RSS Feed
- Permalink
- Notify Moderator
I revised the Mathcad formula but still it is not working . What is wrong with my formula ?
- Mark as New
- Bookmark
- Subscribe
- Mute
- Subscribe to RSS Feed
- Permalink
- Notify Moderator
Sorry - I have Prime 3 not 3.1
- Mark as New
- Bookmark
- Subscribe
- Mute
- Subscribe to RSS Feed
- Permalink
- Notify Moderator
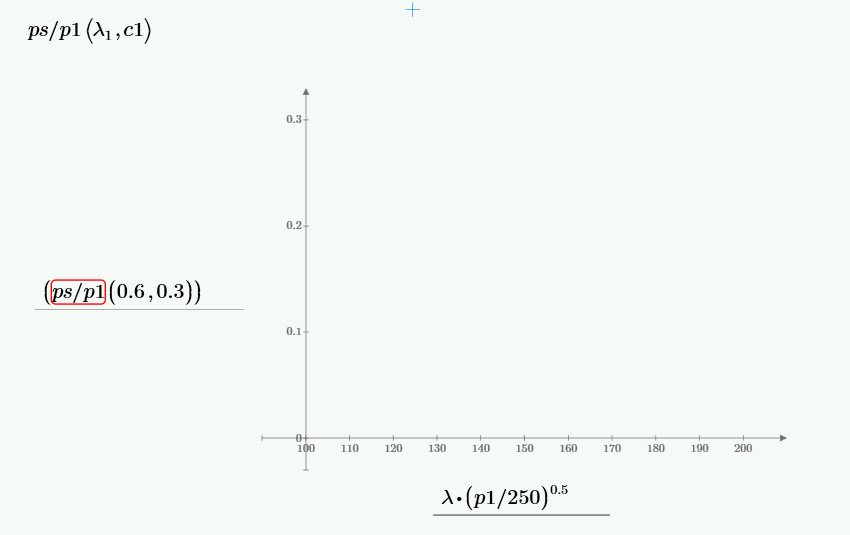
this is how I make it . but still mot working

- Mark as New
- Bookmark
- Subscribe
- Mute
- Subscribe to RSS Feed
- Permalink
- Notify Moderator

- Mark as New
- Bookmark
- Subscribe
- Mute
- Subscribe to RSS Feed
- Permalink
- Notify Moderator
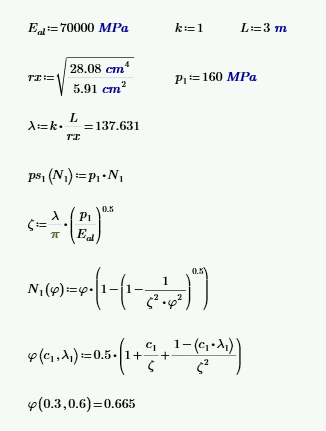
Am I close now to the correct answer ? I cannot see lines in the graph

- Mark as New
- Bookmark
- Subscribe
- Mute
- Subscribe to RSS Feed
- Permalink
- Notify Moderator
As far as I can tell from a picture, you are a long way from the correct answer. It appears that you do not understand how Mathcad works. You have defined p1 as a scalar (i.e single) value. You have defined lambda as a scalar value. Therefore what you have on your x-axis is a scalar value. Why do you expect to see a graph with a single value on the x-axis? At best, you would see a graph with one point. On your y-axis you appear to have a variable name. As far as I can see, that variable is undefined, so I'm surprised Mathcad does not flag it with an error.
To plot a 2D graph you need one of the following:
1) A function, e.g. f(x), on the y-axis, and an undefined variable, x on the x-axis. Mathcad assigns a range of values to x. This is a "quickplot", and I don't recommend it.
2) A function, e.g. f(x), on the y-axis, and a variable, x, defined as a range, on the x-axis. This is the same as (1), but you decide the range by defining x as a range variable.
3) A function, e.g. f(x), on the y-axis, and a variable, x, defined as a vector, on the x-axis. This is the same as (1), but you decide the range by defining x as a vector. In this case you may need to use the vectorization operator to get it to work.
4) A vector, y, on the y-axis, and a vector, x, with the same number of elements, on the x-axis.
All of the above can be extended to plot multiple curves at once, but there's not much point in discussing that until you can get one curve.
- Mark as New
- Bookmark
- Subscribe
- Mute
- Subscribe to RSS Feed
- Permalink
- Notify Moderator
Lex Dante wrote:
I cannot see lines in the graph
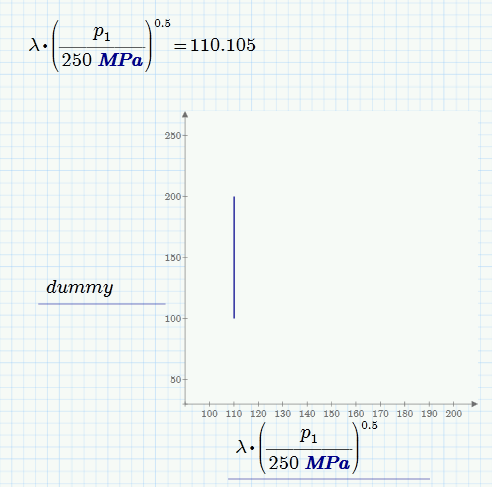
Your graph has to be a vertical line!
At the abscissa you have a constant value 110,105 and at the ordinate you have an undefined variable (the fact that you name it "ps1/p1" does not relate it in any way to your formulas). Prime obviously uses some sort of quickplot-feature to show a plot but I have no idea though, why it only shows up in the range 100 to 200. I would have expected a range from -10 to 10, as usual for Primes quickplot.
Concerning the plot you are after I guess you have to read and re-read Richards answer and have to invest more time figuring out which value depends on which and create appropriate functions.
EDIT: I now see why the ordinate range is from 100 to 200 - thats because I had set the abscissa range that way !
- Mark as New
- Bookmark
- Subscribe
- Mute
- Subscribe to RSS Feed
- Permalink
- Notify Moderator
![]() Thank you for all the pointers of how to make a graph. I will try to revised it base on your comments.
Thank you for all the pointers of how to make a graph. I will try to revised it base on your comments.
- Mark as New
- Bookmark
- Subscribe
- Mute
- Subscribe to RSS Feed
- Permalink
- Notify Moderator
Lex Dante wrote:
Thank you for all the pointers of how to make a graph. I will try to revised it base on your comments.
Thanks for you, Lex!
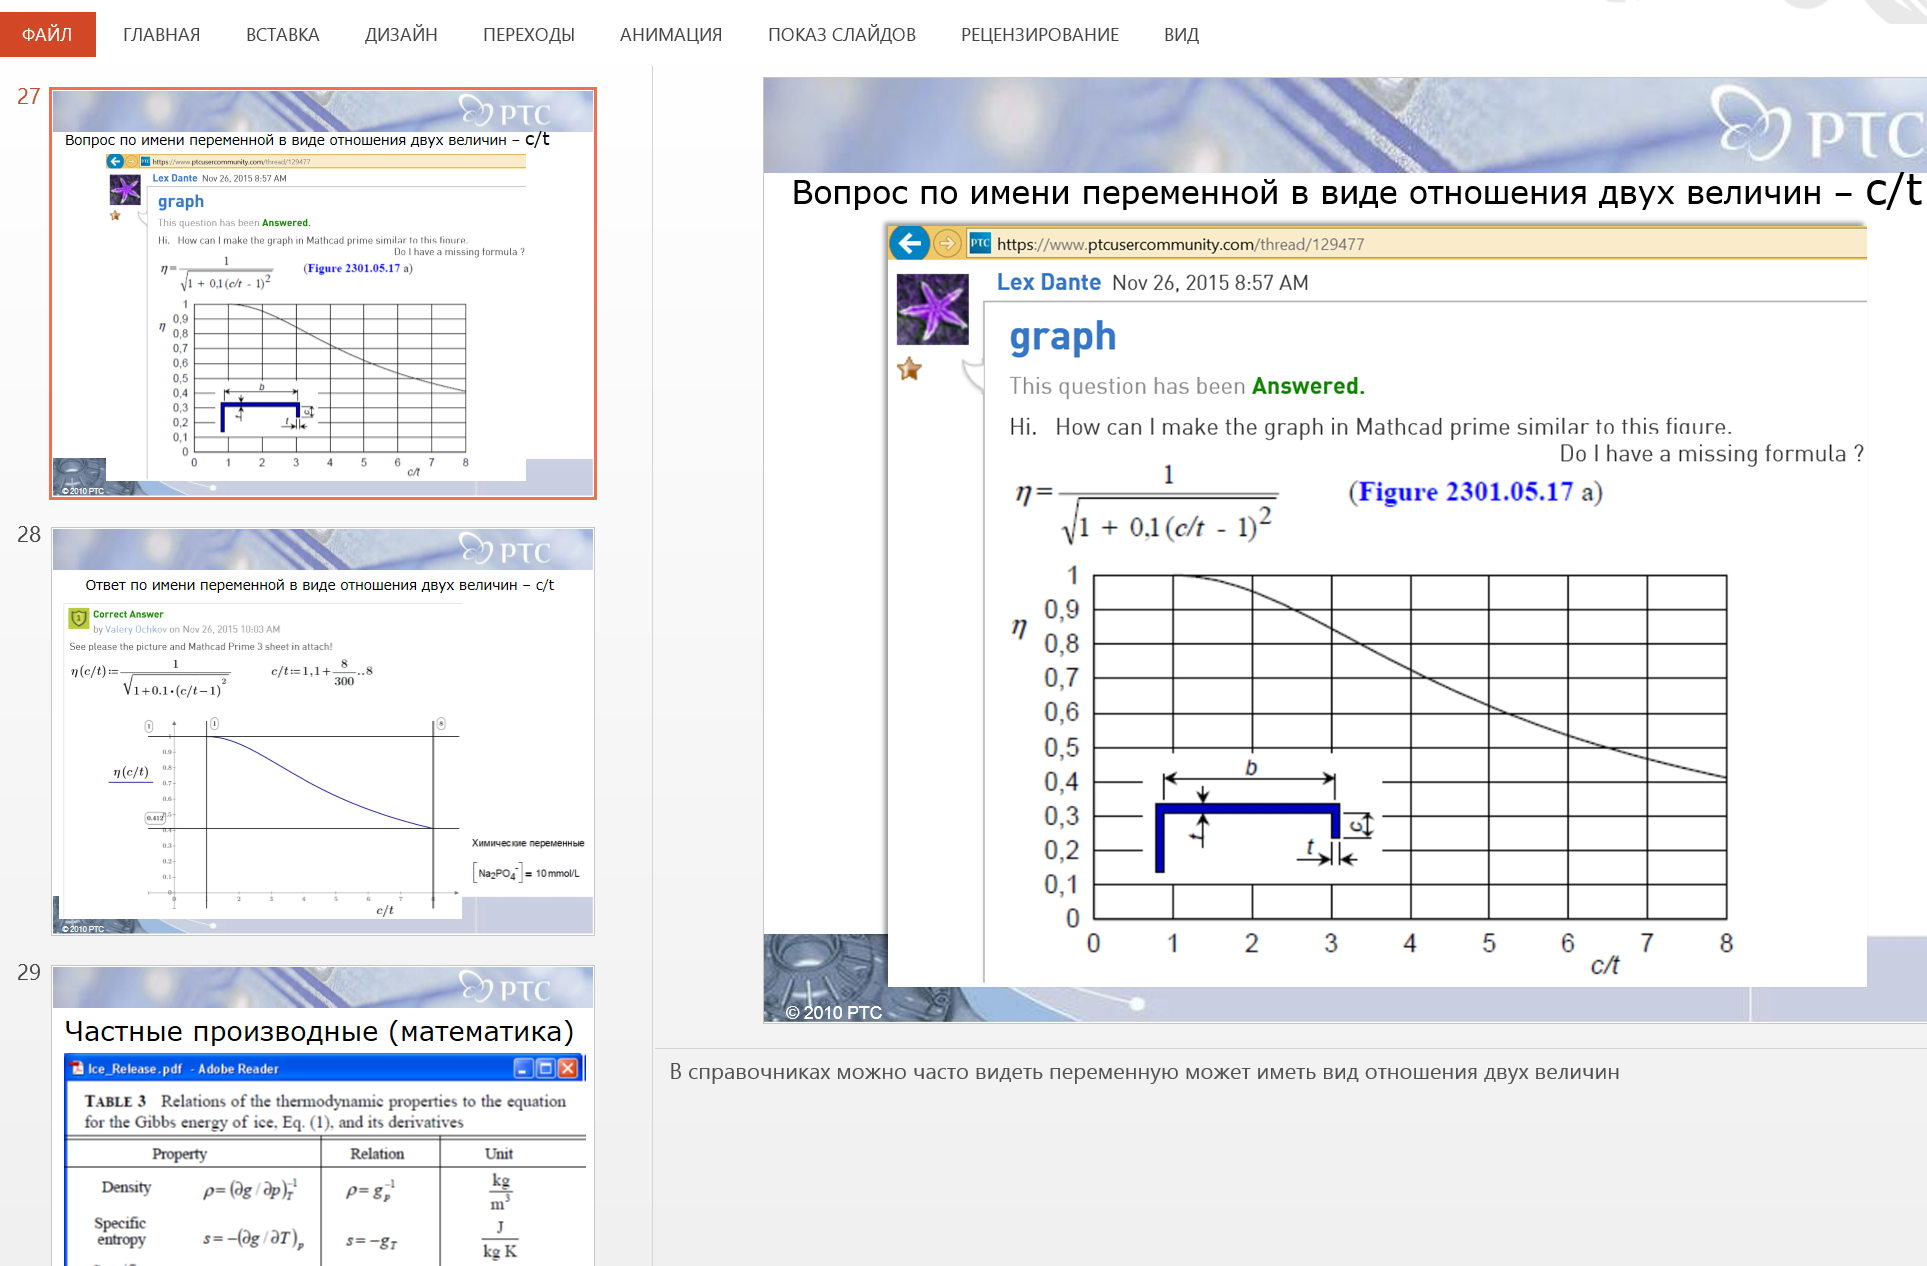
I will use your graph example with the c/t variable in my presentation 2015/12/1
- Mark as New
- Bookmark
- Subscribe
- Mute
- Subscribe to RSS Feed
- Permalink
- Notify Moderator
ok . I also appreciate your support for all Mathcad beginner like us.
- Mark as New
- Bookmark
- Subscribe
- Mute
- Subscribe to RSS Feed
- Permalink
- Notify Moderator
One part of participants of this seminar is beginners, others one - guru in Mathcad.
But the seminar must be interesting for both parts!
- Mark as New
- Bookmark
- Subscribe
- Mute
- Subscribe to RSS Feed
- Permalink
- Notify Moderator
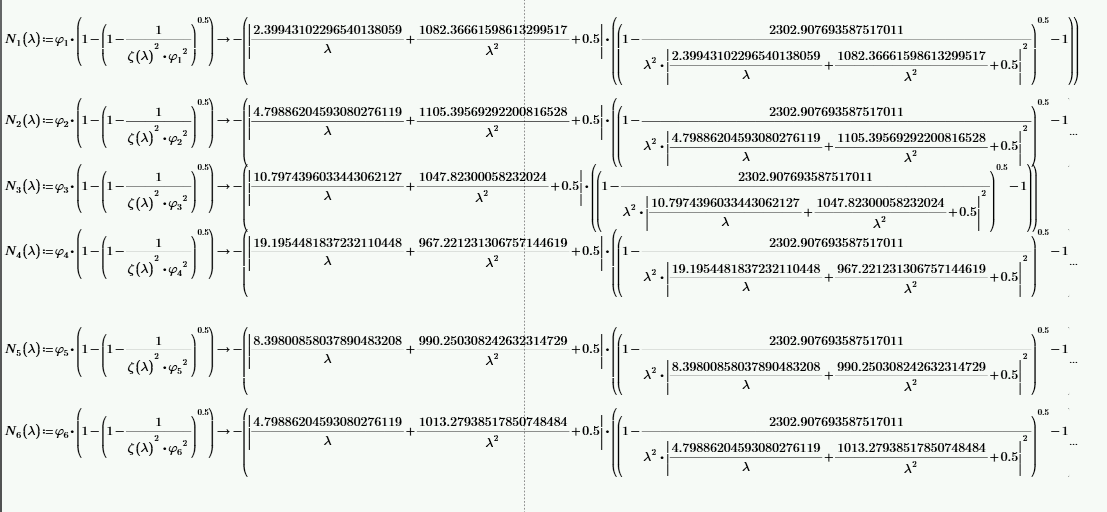
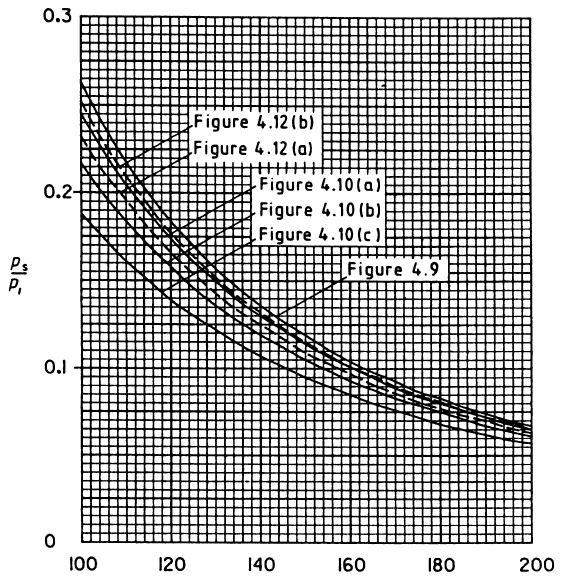
I got the solution for the 2nd graph . The symbolic evaluation help me to have a single undefined variable.


- Mark as New
- Bookmark
- Subscribe
- Mute
- Subscribe to RSS Feed
- Permalink
- Notify Moderator
Great!
- Mark as New
- Bookmark
- Subscribe
- Mute
- Subscribe to RSS Feed
- Permalink
- Notify Moderator
Great that you managed to get what you wanted.
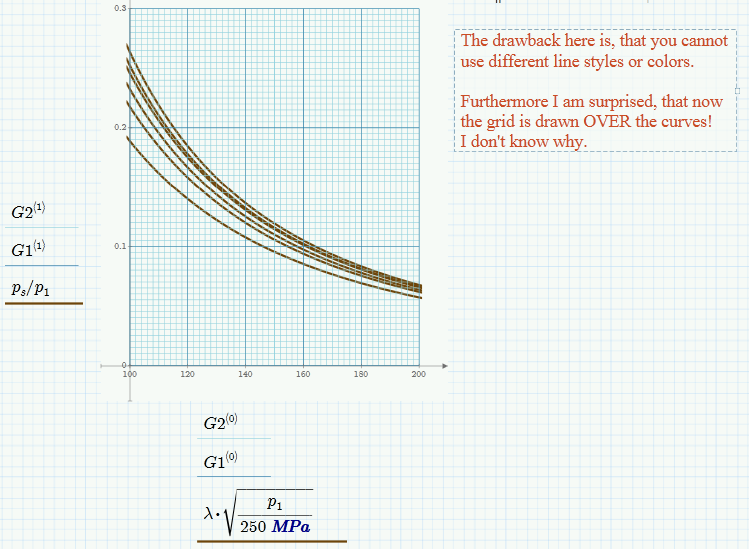
Your method is a bit too elaborate for me and the use of the symbolic evaluation is not really necessary.
See attached Prime 3.0 file for an alternative and a way to add a grid and subgrid.

Werner
EDIT: I added a version using a waterfall plot.
Has anybody an explanation why now the grid is drawn OVER the curves?
- Mark as New
- Bookmark
- Subscribe
- Mute
- Subscribe to RSS Feed
- Permalink
- Notify Moderator
@![]() thank you.
thank you.


