Community Tip - Visit the PTCooler (the community lounge) to get to know your fellow community members and check out some of Dale's Friday Humor posts! X
- Subscribe to RSS Feed
- Mark Topic as New
- Mark Topic as Read
- Float this Topic for Current User
- Bookmark
- Subscribe
- Mute
- Printer Friendly Page
min and max of a function
- Mark as New
- Bookmark
- Subscribe
- Mute
- Subscribe to RSS Feed
- Permalink
- Notify Moderator
min and max of a function
Good afternoon.
I'd like to find the MIN and MAX of a function. Doing MINIMIZE or MINIMIZE I have the error that "the variable is undefined".
Doing the derivate it does not work.
How can I do?
If you want I can attach the code.
Solved! Go to Solution.
- Labels:
-
Mathcad Usage
Accepted Solutions
- Mark as New
- Bookmark
- Subscribe
- Mute
- Subscribe to RSS Feed
- Permalink
- Notify Moderator
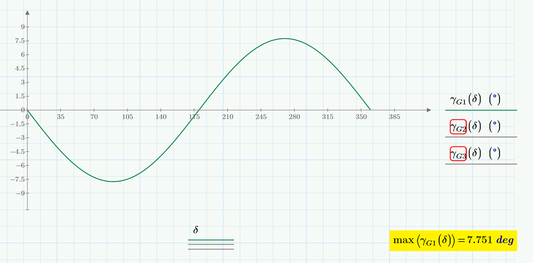
Yes, great! But there's more than one function in there.
Assuming you want the extremes of gamma.G1, here goes:
Note that I'm just inserting pictures, because I don't have a full Prime. (I'm limited to Express, which means no programs, no symbolics, no means and other silly limitations.)
So you will have to recreate this yourself in Prime 5 (which is a good exercise by the way!).
Success!
Luc
P.S. I noticed that you have a VERY poor display of numeric values set in your sheet. All numbers are displayed with no fractional parts. This can be very confusing. Take care!
- Mark as New
- Bookmark
- Subscribe
- Mute
- Subscribe to RSS Feed
- Permalink
- Notify Moderator
To find the min and max of a function you can use several methods. However the functions Minimize() and Maximize() have a different purpose (I suggest, you look them up in the help).
Assuming you have a mathematical description of the function, the best way is to differentiate that function, find the zero's of the derivative andf check for each of those if it's a minimum or a maximum etc.. You've probably learnt that in school. Note that Mathcad will allow you to differentiate symbolically or numerically.
Another way is to step your running value from start to end of its domain and calculate each corresponding function value and determine whether it's the lowest or highest value you've encountered. By the end you should have the two extremes. This method is less accurate, of course: you might miss a narrow peak or valley.
Since you did not provide a worksheet, no help with your specific function is possible.
Success!
Luc
- Mark as New
- Bookmark
- Subscribe
- Mute
- Subscribe to RSS Feed
- Permalink
- Notify Moderator
Attach your file. Can't do mathcad with pictures.
- Mark as New
- Bookmark
- Subscribe
- Mute
- Subscribe to RSS Feed
- Permalink
- Notify Moderator
- Mark as New
- Bookmark
- Subscribe
- Mute
- Subscribe to RSS Feed
- Permalink
- Notify Moderator
Its hard to work with pictures so you sure should attach your worksheet if possible.
One suggestion:
1) below the plot write δv:=δ= (the last evaluation = is important as is turns the range into a vector).
2) Change the "maximize" in the expression below to "max" and the "δ" to "δv"
Did this do the trick?
If not, you may have to vectorize the function call "P.c_all_max(δv)".
Thats the operation which is shown as an arrow over the expression.
- Mark as New
- Bookmark
- Subscribe
- Mute
- Subscribe to RSS Feed
- Permalink
- Notify Moderator
Hi guys.
I'm attaching the Mathcad file.
I'd like to find the MAX and MIN of the function
Let me know if you can.
Andrea
- Mark as New
- Bookmark
- Subscribe
- Mute
- Subscribe to RSS Feed
- Permalink
- Notify Moderator
Please indicate of which function you would like to find the extremes.
(Note: you cannot past a picture, you have to use the 'Photos' icon above the edit window to insert a picture in your post.)
Success!
Luc
- Mark as New
- Bookmark
- Subscribe
- Mute
- Subscribe to RSS Feed
- Permalink
- Notify Moderator
Luc.
I have attached the mathcad file.
Andrea
- Mark as New
- Bookmark
- Subscribe
- Mute
- Subscribe to RSS Feed
- Permalink
- Notify Moderator
Yes, great! But there's more than one function in there.
Assuming you want the extremes of gamma.G1, here goes:
Note that I'm just inserting pictures, because I don't have a full Prime. (I'm limited to Express, which means no programs, no symbolics, no means and other silly limitations.)
So you will have to recreate this yourself in Prime 5 (which is a good exercise by the way!).
Success!
Luc
P.S. I noticed that you have a VERY poor display of numeric values set in your sheet. All numbers are displayed with no fractional parts. This can be very confusing. Take care!
- Mark as New
- Bookmark
- Subscribe
- Mute
- Subscribe to RSS Feed
- Permalink
- Notify Moderator
Many thanks Luc!!
- Mark as New
- Bookmark
- Subscribe
- Mute
- Subscribe to RSS Feed
- Permalink
- Notify Moderator
Its easy as your delta already is a vector:


