Community Tip - When posting, your subject should be specific and summarize your question. Here are some additional tips on asking a great question. X
- Community
- Creo+ and Creo Parametric
- System Administration, Installation, and Licensing topics
- Re: Get Smart - Creo Functionality Usage
- Subscribe to RSS Feed
- Mark Topic as New
- Mark Topic as Read
- Float this Topic for Current User
- Bookmark
- Subscribe
- Mute
- Printer Friendly Page
Get Smart - Creo Functionality Usage
- Mark as New
- Bookmark
- Subscribe
- Mute
- Subscribe to RSS Feed
- Permalink
- Notify Moderator
Get Smart - Creo Functionality Usage
The Functional Area Usage page provides an overall summary of the PTC Creofunctionality used in your organization.
Access Location: In the Go to page list, select Functional Area Usage.
Benefits and Description
- Labels:
-
Performance Advisor
- Mark as New
- Bookmark
- Subscribe
- Mute
- Subscribe to RSS Feed
- Permalink
- Notify Moderator
Dan, I have a couple of questions.
1.) I see the dashboard, and all of our systems are configured to send data to PTC, but everything is showing zeros. Is there something that needs to happen to turn on this tracking? (We are running Creo 3.0 M090 & M100)
2.) You said in your video that only the owned functionality will be displayed. I'm seeing many functions that we don't own (options modeler, mold, mfg, etc.) Any idea why?
3.) I know this is a different topic, but this new capability is not nearly as useful without the ability to relate the GUID to an actual user. For those of us who are willing to upload machine and user name, please allow this information to be displayed instead.
- Mark as New
- Bookmark
- Subscribe
- Mute
- Subscribe to RSS Feed
- Permalink
- Notify Moderator
Tom,
Jim Barrett-Smith wrote:
Hi Marco
Hopefully in the next release we will be able to tie the report of the unused apps to your license file. Feature tracking was a huge project and there was only so much we could achieve in the first release.
You can find his answer to my question here Enable Performance Advisor to show the real Login Name and Host Name of sessions instead of the masked data currently av…
- Mark as New
- Bookmark
- Subscribe
- Mute
- Subscribe to RSS Feed
- Permalink
- Notify Moderator
I'm asking the question specifically because in the video Dan said this is the current behavior.
- Mark as New
- Bookmark
- Subscribe
- Mute
- Subscribe to RSS Feed
- Permalink
- Notify Moderator
I think they made the video with some beta version of PA, because in my dashboard nothing appears under Functionality area.
- Mark as New
- Bookmark
- Subscribe
- Mute
- Subscribe to RSS Feed
- Permalink
- Notify Moderator
Hi Tom,
First off, thanks for watching the video.
1) Your builds of Creo 3.0 are certainly compatible with this functionality (Creo 2.0 M220+ / Creo 3.0 M090+) - Can you check the zip files in the quality agent sentfiles folder at "\AppData\Local\PTC\QualityAgent\SentFiles"? You are looking for files named "featureTracking.....json". If they are indeed being sent, we need a deeper investigation with a TSE, which i can help start.
2) I contacted the PM to ask about this observation; I am not sure if he misspoke in the video, or if its not working as designed.
3) Yes, I hear you. PM is investigating the best, and safest way to address this from out side. For now, I suggest looking at the workaround script documented here (How to identify a user in Performance Advisor). Pairing this collection script with a browser extension called a 'word replacer' can solve the issue. I did a POC of this, but I don't feel comfortable posting the full solution here as a PTC employee. If someone were to connect the dots, or even post the full solution, i am sure they would be very popular here ![]() ).
).
Thanks for the feedback, and look for further improvements as we all grow in this arena.
-Dan
- Mark as New
- Bookmark
- Subscribe
- Mute
- Subscribe to RSS Feed
- Permalink
- Notify Moderator
Here's what I see:
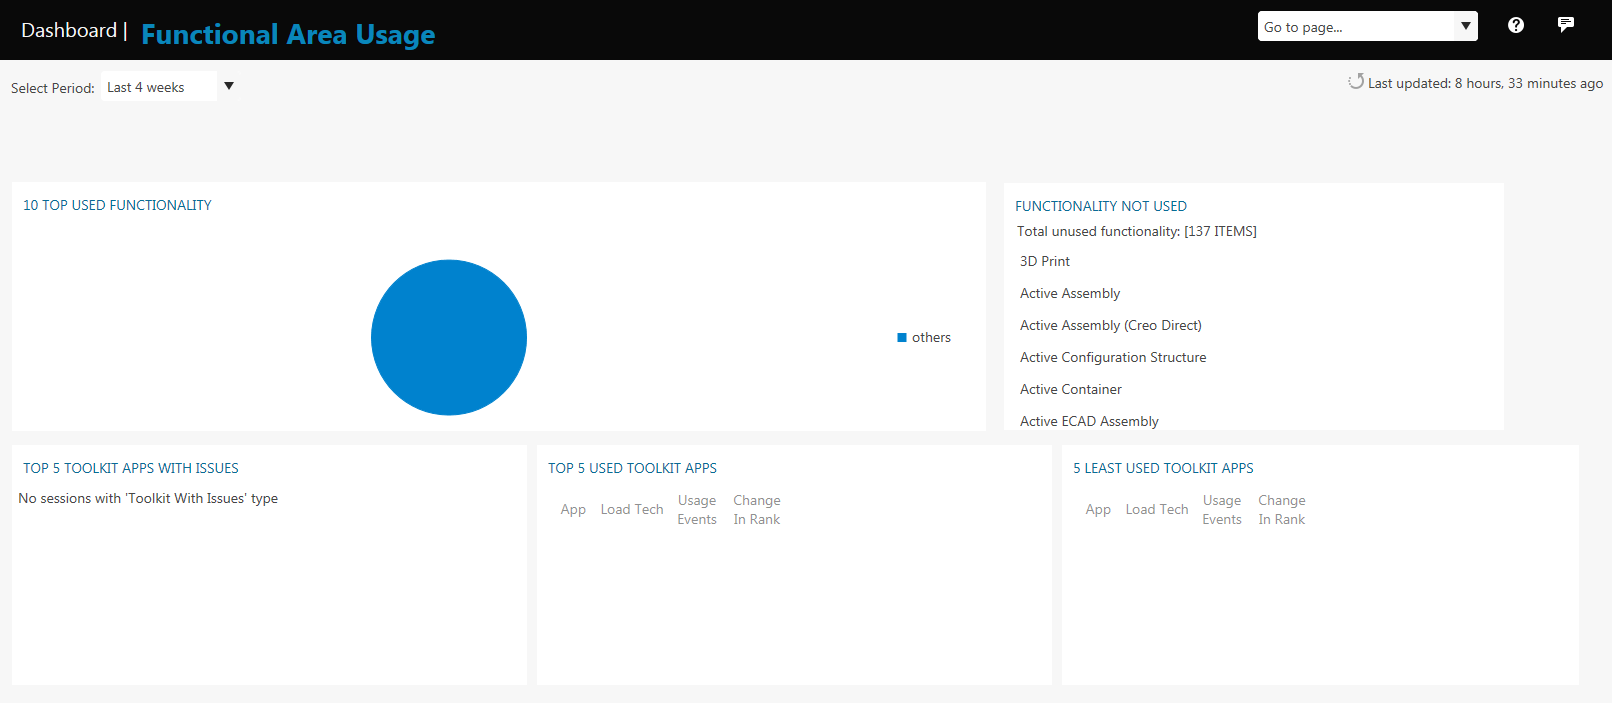
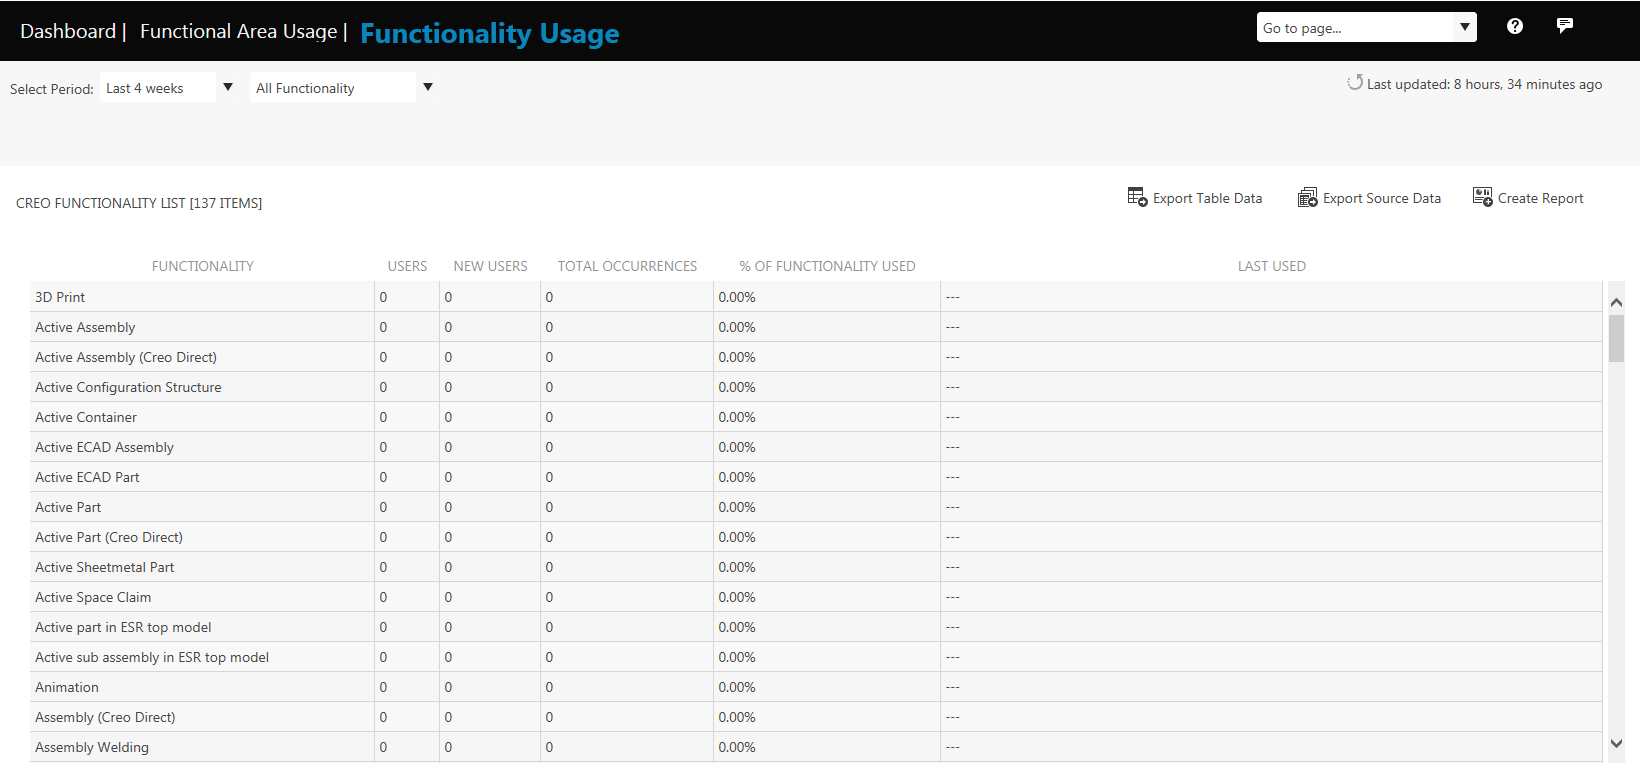


By the way, I just listened again and he said, "you can also review functionality that you do own but is not currently being used".
- Mark as New
- Bookmark
- Subscribe
- Mute
- Subscribe to RSS Feed
- Permalink
- Notify Moderator
Dan, Thanks for the reply.
I was wrong about the builds. Most of our users are still on M080 and the .json file isn't present in their sent data. On the other hand, I have been running M100 since July 1st (8 days) and all of those .zip file DO include the feature tracking .json files.

Here is the "guts" of one of them (minus the UUID):
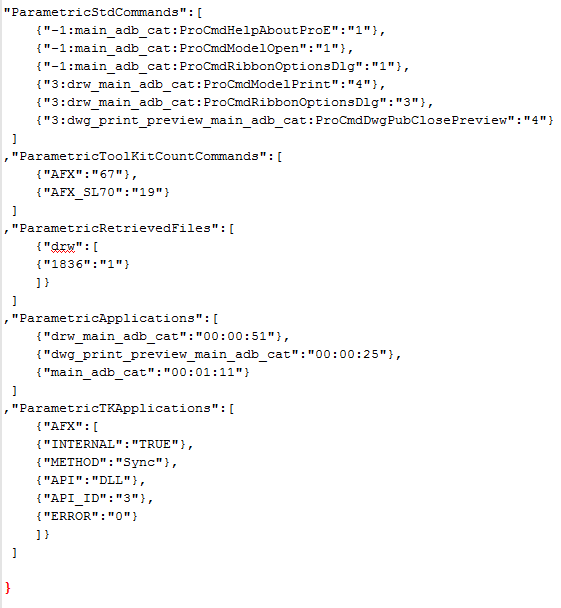
Does a certain period of time have to pass (more than 8 days) before reporting becomes available? (I'm hoping not 4 weeks...)
Thanks.
- Mark as New
- Bookmark
- Subscribe
- Mute
- Subscribe to RSS Feed
- Permalink
- Notify Moderator
Tom Uminn #2 will need an SPR after discussion with Jim (PM). Can I have an engineer initiate an case and contact you? - I will post the article tracking the issue once created.
- Dan
- Mark as New
- Bookmark
- Subscribe
- Mute
- Subscribe to RSS Feed
- Permalink
- Notify Moderator
Was this json in the sentfiles folder? - If so, i will contact IT.
- Mark as New
- Bookmark
- Subscribe
- Mute
- Subscribe to RSS Feed
- Permalink
- Notify Moderator
Dan,
maybe could be the old issue about sessions in Sentfiles folder not loaded?
I'm still having less than 50% of sent sessions visibile in my dashboard.
- Mark as New
- Bookmark
- Subscribe
- Mute
- Subscribe to RSS Feed
- Permalink
- Notify Moderator
Definitely. Feel free to create a case.
Yes, the .json files are inside the .zip files inside the sent files folder. In fact the last one sent actually includes three separate featureTracking_xxx.json files.
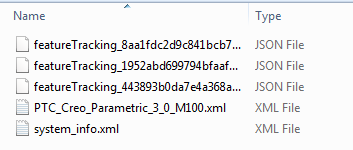
Each one appears to be tied to a unique UUID.
- Mark as New
- Bookmark
- Subscribe
- Mute
- Subscribe to RSS Feed
- Permalink
- Notify Moderator
i created case 13177985 for you Tom. To investigate the display of un-owned functionality in the list.
- Mark as New
- Bookmark
- Subscribe
- Mute
- Subscribe to RSS Feed
- Permalink
- Notify Moderator
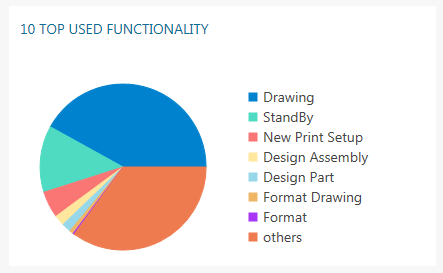
By the way, I switched part of our user base over to M100 on Friday and I am starting to see some data:
- Mark as New
- Bookmark
- Subscribe
- Mute
- Subscribe to RSS Feed
- Permalink
- Notify Moderator
Hi Marco,
I checked with IT to make sure there were no unresolved issues. It seems everything should be flowing freely. If you are experiencing any missing data. I think we should have a case opened, sentfiles data attached, so we can track down the problem.
- Dan
- Mark as New
- Bookmark
- Subscribe
- Mute
- Subscribe to RSS Feed
- Permalink
- Notify Moderator
Hi Dan,
I have 6 case awaiting an SPR resolution and 2 open case (one was open yesterday), so I think there is still something to do by R&D.
The two cases about sessions not loaded are:
Some sessions in the SentFiles folder are not displayed in the dashboard
https://support.ptc.com/apps/case_logger_viewer/auth/ssl/case=12799022
It's been now three days since no new data appears in my dashboard
https://support.ptc.com/apps/case_logger_viewer/auth/ssl/case=12837883
I have just updated the first case with dozens of sessions not loaded after we switch from Creo 2 M160 to M210.
- Mark as New
- Bookmark
- Subscribe
- Mute
- Subscribe to RSS Feed
- Permalink
- Notify Moderator
Dan Nowitz, you said:
...investigate the display of un-owned functionality in the list.
Can you shed any light on how this is supposed to work? It seems like it would quickly turn into a complete mess.
- Is it supposed to show functionality based on the licenses currently owned or ever owned?
- Is it looking at the licenses actually used by the client each time that client sends data or is it comparing what the client used to some global features list?
- If a license is no longer used by a company, how long before that functionality "falls off" the unused features list?
- What about different facilities/departments/locations? They could have completely different licenses available. It doesn't seem like it would make sense to show features of licenses that the company may own but that a particular location or user base doesn't have access to.
- Does this tool include data from multiple SCNs? (Perpetual licenses and subscription licenses require different SCNs even though the company is the same.)
- Mark as New
- Bookmark
- Subscribe
- Mute
- Subscribe to RSS Feed
- Permalink
- Notify Moderator
Tom
I made a mistake in the video, currently we are reporting all ribbons, so the unused functionality list WILL include functionality that you do not own.
thanks, Jim
- Mark as New
- Bookmark
- Subscribe
- Mute
- Subscribe to RSS Feed
- Permalink
- Notify Moderator
Thanks Jim Barrett-Smith. I guess I should let tech support know. ![]()
Is this filtering something you are planning to add in the future? If so, can you shed any light on how you think it might work based on the questions above?
- Mark as New
- Bookmark
- Subscribe
- Mute
- Subscribe to RSS Feed
- Permalink
- Notify Moderator
Dan Nowitz and Jim Barrett-Smith,
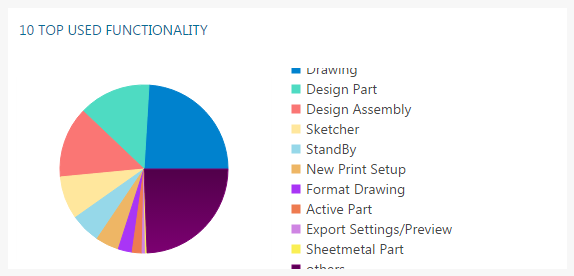
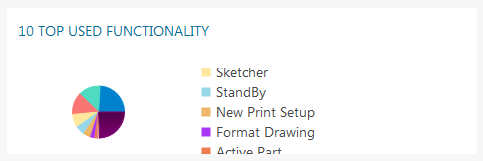
I noticed today that the areas listed in the "10 TOP USED FUNCTIONALITY" area are clipped, don't scale like the pie chart, and don't include a scroll bar (like the section next to it.) This seems to be consistent across Chrome, Firefox, and Internet Explorer.
Browser set to full screen:

Browser less than full screen (typical for me):
Browser widow set a little smaller:
- Mark as New
- Bookmark
- Subscribe
- Mute
- Subscribe to RSS Feed
- Permalink
- Notify Moderator
Hi Tom,
have you seen any data in Functionality Usage gadget?
Yesterday I made some test with Creo 2 M230.
Most of the times I have simply started and closed Creo session, but a couple of time I have created some simple feature.
All these sessions were loaded in our dashboard, but nothing appeared in Functionality gadget.
- Mark as New
- Bookmark
- Subscribe
- Mute
- Subscribe to RSS Feed
- Permalink
- Notify Moderator
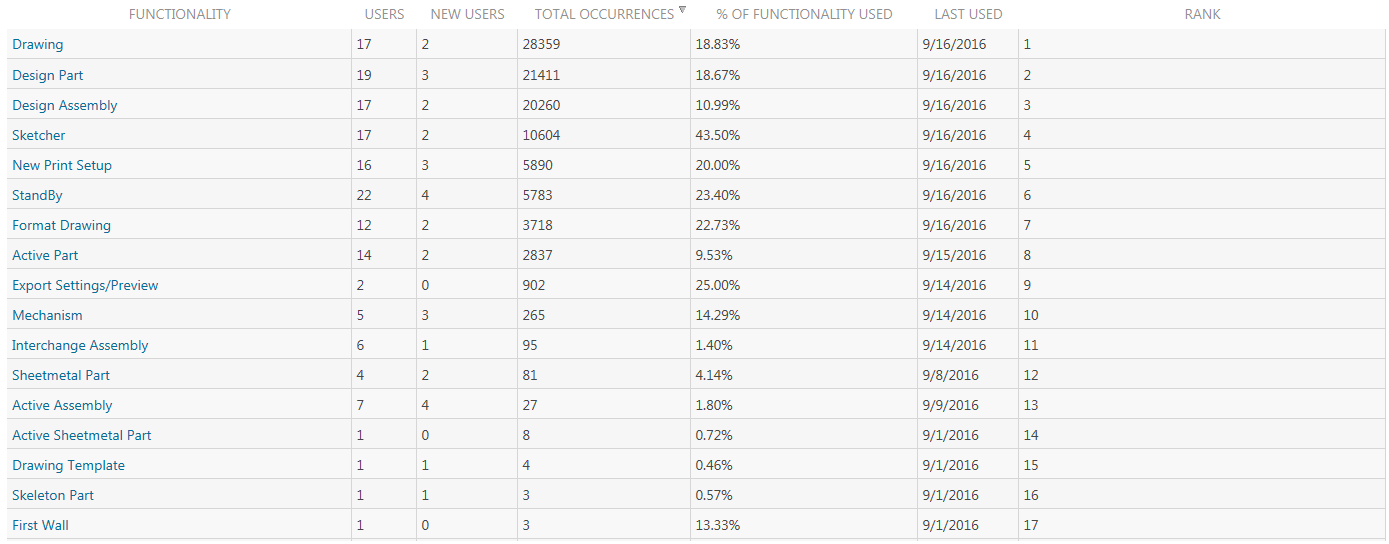
Yes, I am seeing data. Make sure you are seeing "featureTracking_xxx.json" files in your sent data.
- Mark as New
- Bookmark
- Subscribe
- Mute
- Subscribe to RSS Feed
- Permalink
- Notify Moderator
Hi Tom,
thanks for your answer.
Today I started to see data in Functionality gadget of sessions appeared last week, so I believe that this data are loaded a couple of days after sessions.


