- Community
- ThingWorx
- ThingWorx Developers
- Re: How can I see Kepware values in a chart?
- Subscribe to RSS Feed
- Mark Topic as New
- Mark Topic as Read
- Float this Topic for Current User
- Bookmark
- Subscribe
- Mute
- Printer Friendly Page
How can I see Kepware values in a chart?
- Mark as New
- Bookmark
- Subscribe
- Mute
- Subscribe to RSS Feed
- Permalink
- Notify Moderator
How can I see Kepware values in a chart?
Hi there,
I am quite new in Thingworx world. I have kepware and thingworx connected and I can see values changing in a mashup. My next step is displaying data in a chart in real time, I mean I want to see curves changing. I have been searching in the community for examples but I am very confused about how to do that. I have found two different ways (I don't know if there are more):
- Using a template create from a thing and calling to "GetimplementedthingswithData" service, this doesn't work for me:
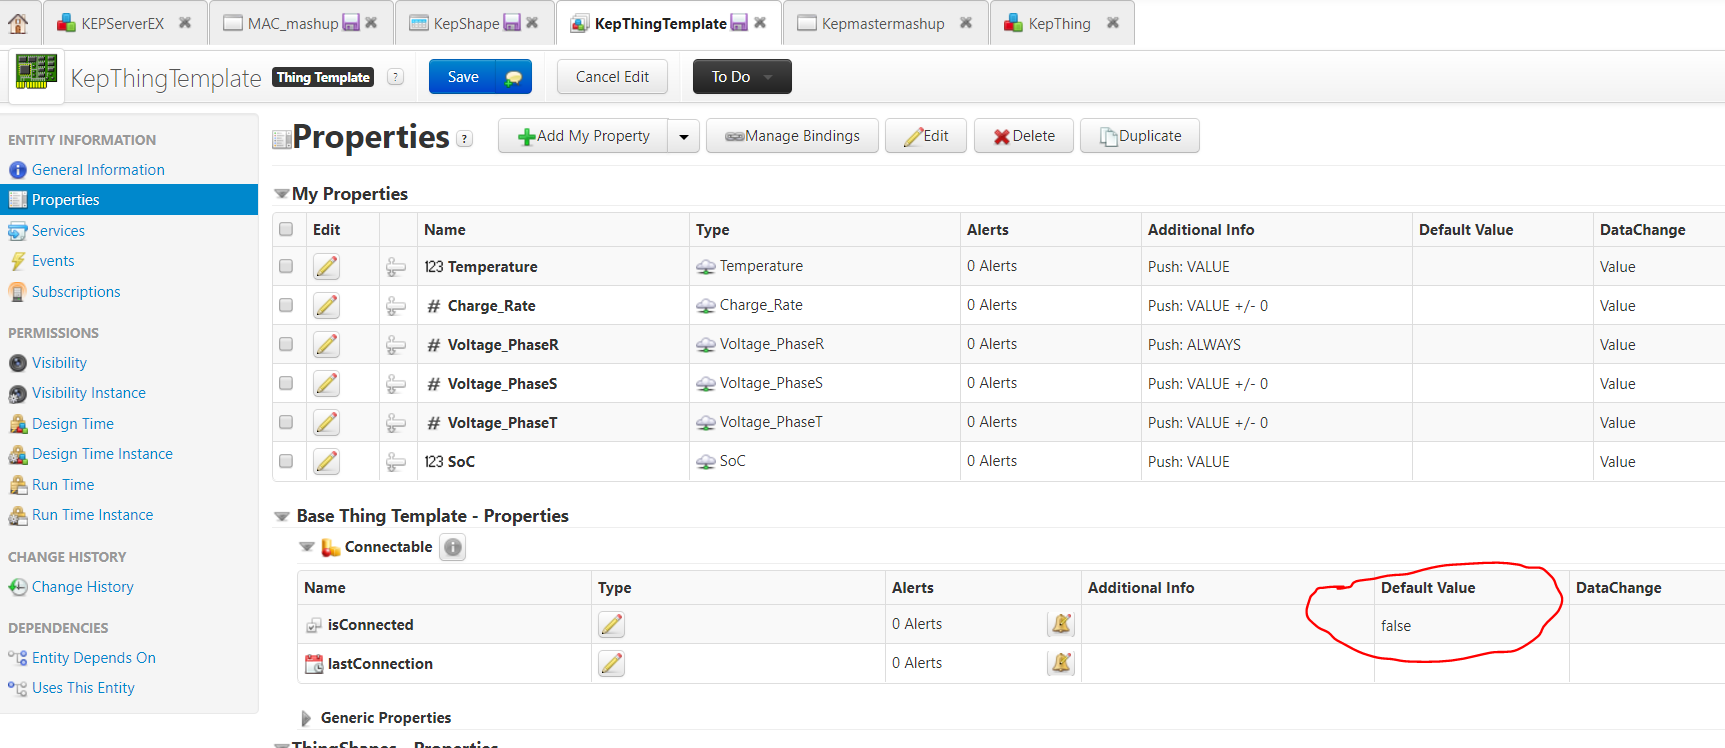
- I created my Industrial Connection (KEPServerEX) and industrial thing (KEPThing) in New Composer, as explained in the Help Center. Now I have created a template from the KEPThing, but this template is not connected so I cannot get data from Kepware despite it has inherited the KEPThing properties. In the mashup, I can call the "GetimplementedthingswithData" service and bind the data to the time series chart but, as the template is disconnected, there is no values displayed.

- Create an Info Table from a datashape. As far as I have understood, you create a table and full it with data, then you bind this data to the chart. I have seen an example that explains how to create an Infotable, but in this example the data is entered manually and I want to get the data from Kepware. I have seen this video Advanced Chart Widgets Tutorial - YouTube which is what I want to do, but it doesn't explain how to create that dataShape.
I am using the famous Simulation Examples of Kepware.
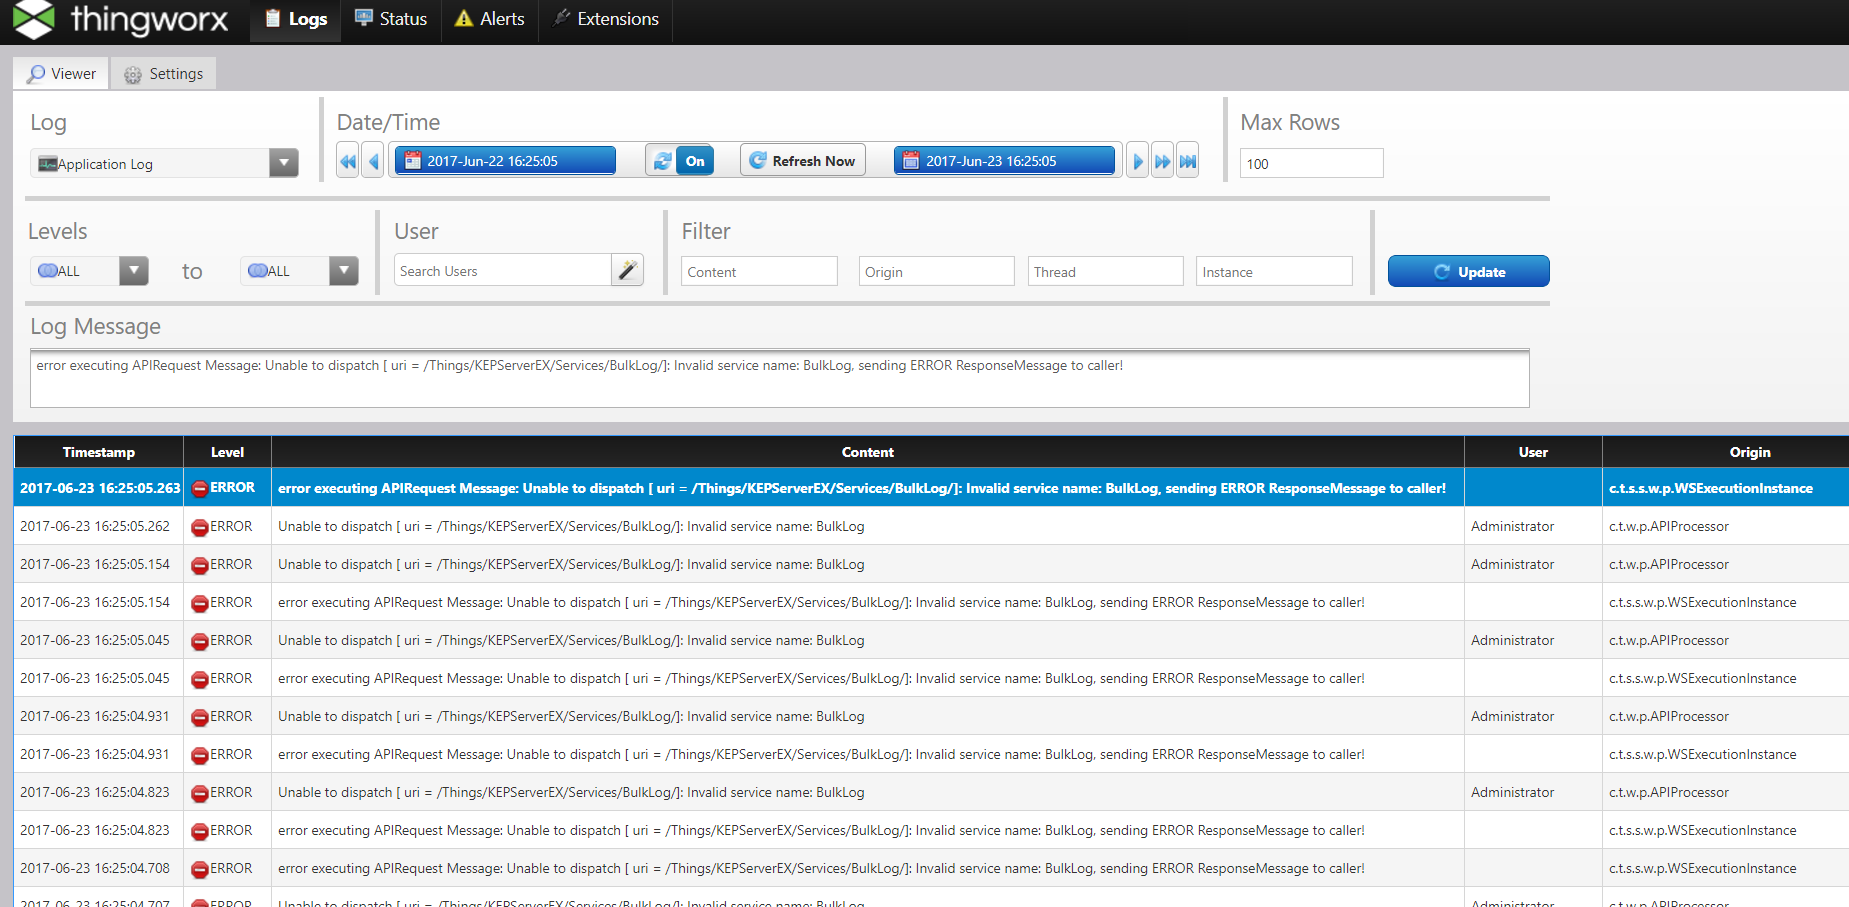
If helps, this is the event log window:

I you could provide me with some guidance, it would be very much appreciate.
Many thanks in advanced.
Solved! Go to Solution.
- Labels:
-
Connectivity
Accepted Solutions
- Mark as New
- Bookmark
- Subscribe
- Mute
- Subscribe to RSS Feed
- Permalink
- Notify Moderator
Youc could consider to use Value Stream to store your data.
After you successfully discovered Tags in your KEPServerEX Thing, You browse the Tags in Kepware from KEPServerEX Thing, and then you bind it to a New Thing with "Bind to New Entity", and this new Entity is based on IndustrialGateway Template, and also remember to set a Value Stream:

Set the bound Tags which you want to show in mashup with "Logged".
And then you bind QueryPropertyHistory in the new kepware Thing in your mashup, and bind the Returned Data to Time Series Chart. To get refreshed periodically, you could add a Auto Refresh widget in your mashup.
Hope this helps,
Br,
Anna
- Mark as New
- Bookmark
- Subscribe
- Mute
- Subscribe to RSS Feed
- Permalink
- Notify Moderator
Hi,
1. Assign Value Stream to your Kepware Template and enable logging for properties to be displayed in Chart.
2. Add "QueryPropertyHistroy" service in Mashup for your "THING" and map "AllData" to your Chart Widget.
- Mark as New
- Bookmark
- Subscribe
- Mute
- Subscribe to RSS Feed
- Permalink
- Notify Moderator
Youc could consider to use Value Stream to store your data.
After you successfully discovered Tags in your KEPServerEX Thing, You browse the Tags in Kepware from KEPServerEX Thing, and then you bind it to a New Thing with "Bind to New Entity", and this new Entity is based on IndustrialGateway Template, and also remember to set a Value Stream:

Set the bound Tags which you want to show in mashup with "Logged".
And then you bind QueryPropertyHistory in the new kepware Thing in your mashup, and bind the Returned Data to Time Series Chart. To get refreshed periodically, you could add a Auto Refresh widget in your mashup.
Hope this helps,
Br,
Anna
- Mark as New
- Bookmark
- Subscribe
- Mute
- Subscribe to RSS Feed
- Permalink
- Notify Moderator
Hi Anna An and Velkumar R,
Thank you very much for your help, now it is working
Best regads.
- Mark as New
- Bookmark
- Subscribe
- Mute
- Subscribe to RSS Feed
- Permalink
- Notify Moderator


