- Community
- ThingWorx
- ThingWorx Developers
- Re: Simple test case: Anomaly Detection is detecti...
- Subscribe to RSS Feed
- Mark Topic as New
- Mark Topic as Read
- Float this Topic for Current User
- Bookmark
- Subscribe
- Mute
- Printer Friendly Page
Simple test case: Anomaly Detection is detecting an anomaly when it shouldn't
- Mark as New
- Bookmark
- Subscribe
- Mute
- Subscribe to RSS Feed
- Permalink
- Notify Moderator
Simple test case: Anomaly Detection is detecting an anomaly when it shouldn't
Hi community,
To test the anomaly detection with a simple use case I followed the steps in this guide, imported the anomaly mashup and to not wait for too long I updated the cmoTimer update rate to 50ms.
I didn't get to the stage of modifying, for example the sine amplitude, because prior to any modification the mashup showed me that is detecting as an anomaly the same sine used for training.
I think that updating the update rate to 50ms shouldn't be the reason of the false positive detection but I could be wrong.
Any thoughts why the anomaly detection is firing when it shouldn't?
Regards
Solved! Go to Solution.
- Labels:
-
Analytics
Accepted Solutions
- Mark as New
- Bookmark
- Subscribe
- Mute
- Subscribe to RSS Feed
- Permalink
- Notify Moderator
Hi @nahuel
Please find attached my entity.
I did some other tests and notice some blip when the timer was at 5 ms, so there is maybe something with load.
Also at 50 ms, sometimes, not always, I see a handful of anomaly at the beginning of monitoring but they disappear after that. So you may want to let it run for a while to check if you have the same behaviour or not.
Thanks
Christophe
- Mark as New
- Bookmark
- Subscribe
- Mute
- Subscribe to RSS Feed
- Permalink
- Notify Moderator
Hi @nahuel
I just made a test with this sample entities with the timer at 50 ms, but it appears to behave properly on my side.
Could you please confirm what version of ThingWorx and ThingWorx Analytics you are using ?
I tested in TWX 9.1.2 - TWA 9.1.0 - maybe you could try in this version too.
Also have you checked the Alert History to confirm anomaly are reported there (to exclude a display issue)
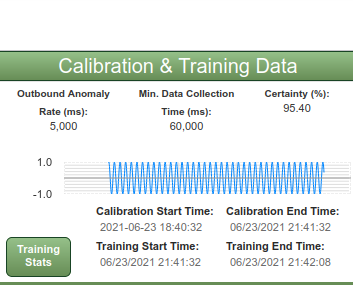
Also the screenshot shows that the calibrating / training time are at 21:42, but the signal data shows at 18:42.
I am not sure that has an impact but it would seem we have a variety of timezone involved. Can you confirm the OS and timezone of both ThingWorx and ThingWorx Analytics server ?
Regards
Christophe
- Mark as New
- Bookmark
- Subscribe
- Mute
- Subscribe to RSS Feed
- Permalink
- Notify Moderator
Hi @cmorfin,
On my side I have the following versions
TWX 9.1.0-b10877
TWA 9.1.0-r4
I checked and the anomalies are being reported to the Alert History stream.
Regarding the difference in time, both, TWX and TWA, are installed in the same Windows Server 2016 Datacenter machine, and the timezone is set to UTC.
I looked at the Anomaly_Dashboard_Property mashup and I think that the difference in time is related to the FormatDate service (of the AnomalyServices thing) and that the server timezone is UTC and my browser timezone is UTC-3.
I looked at the FormatDate service, and the dateFormat string does not have the timezone into account.
I tried bypassing that service and binding directly to the Calibration Start Time widget and the time is displayed correctly (the format is different but the value is ok). Check the screenshot below.
I repeated the test for 50ms (one more time), 100ms and 1sec - as the update rate value was increased (from 50ms to 1000ms) the number of false positives was reduced but there were always a few. Attached you can find the screenshots for each one.
Any suggestions on how to keep troubleshooting?
- Mark as New
- Bookmark
- Subscribe
- Mute
- Subscribe to RSS Feed
- Permalink
- Notify Moderator
Hi @nahuel
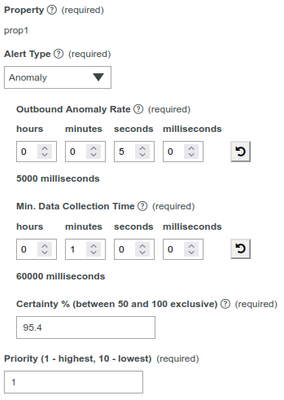
Could you post the configuration details of your anomaly alert ?
The certainty parameter will have an impact on the number of false positive, so you may want to adjust this.
Regards
Christophe
- Mark as New
- Bookmark
- Subscribe
- Mute
- Subscribe to RSS Feed
- Permalink
- Notify Moderator
Hi, @cmorfin.
Sure, here it is.
As suggested in the guide, it is the default configuration, and it is the same for each experiment (50ms, 100ms, 1000ms).
Could the reason be related to hardware sizing or overload?
The VM on which TWX and TWA is installed has the following characteristics
And since this VM is a dev one, it has more PTC components installed too. Here is the list of installed components:
+ TWX
+ TWA
+ Vuforia Experience Service
+ Vuforia Studio
+ Kepware
Regards,
Nahuel
- Mark as New
- Bookmark
- Subscribe
- Mute
- Subscribe to RSS Feed
- Permalink
- Notify Moderator
Hi @cmorfin.
Any thoughts on how to keep troubleshooting? Any log or configuration to look at?
Regards,
Nahuel
- Mark as New
- Bookmark
- Subscribe
- Mute
- Subscribe to RSS Feed
- Permalink
- Notify Moderator
Hi @cmorfin ,
Since the anomaly detection for the sine wave with an update rate of 50ms worked on your side, could you export and share the Thing on which the alert was configured? That way I could import the exported Thing (that includes the correctly trained model) and test if it works correctly on my side.
Kind regards,
Nahuel
- Mark as New
- Bookmark
- Subscribe
- Mute
- Subscribe to RSS Feed
- Permalink
- Notify Moderator
Hi @nahuel
Please find attached my entity.
I did some other tests and notice some blip when the timer was at 5 ms, so there is maybe something with load.
Also at 50 ms, sometimes, not always, I see a handful of anomaly at the beginning of monitoring but they disappear after that. So you may want to let it run for a while to check if you have the same behaviour or not.
Thanks
Christophe
- Mark as New
- Bookmark
- Subscribe
- Mute
- Subscribe to RSS Feed
- Permalink
- Notify Moderator
Hi @cmorfin ,
Thanks for the reply.
I've been doing some tests on my side, and with the following setup I got that the fastest update rate I can get without having glitches is 200ms.
Just as a reference purpose, would you mind sharing your setup?
Regards,
Nahuel
- Mark as New
- Bookmark
- Subscribe
- Mute
- Subscribe to RSS Feed
- Permalink
- Notify Moderator
Hi @nahuel
I am running this on a Windows 10 machine with 32 Gb of RAM and 6 core (12 logical processors)
Regards
Christophe
- Mark as New
- Bookmark
- Subscribe
- Mute
- Subscribe to RSS Feed
- Permalink
- Notify Moderator
Hi @nahuel
If your issue has been resolved with help from one of the previous responses, please mark the appropriate one as the Accepted Solution for the benefit of others with the same problem.
Regards.
--Sharon
- Mark as New
- Bookmark
- Subscribe
- Mute
- Subscribe to RSS Feed
- Permalink
- Notify Moderator
Hi @slangley I'm still running some experiments on this. I'll mark the appropriate response as the Accepted Solution when I solve this issue


