Community Tip - Did you get called away in the middle of writing a post? Don't worry you can find your unfinished post later in the Drafts section of your profile page. X
- Community
- Augmented Reality
- Vuforia Studio
- Re: Problem with Time Series Chart
- Subscribe to RSS Feed
- Mark Topic as New
- Mark Topic as Read
- Float this Topic for Current User
- Bookmark
- Subscribe
- Mute
- Printer Friendly Page
Problem with Time Series Chart
- Mark as New
- Bookmark
- Subscribe
- Mute
- Subscribe to RSS Feed
- Permalink
- Notify Moderator
Problem with Time Series Chart
Hello,
I tried to implement a Time Series Chart today and somehow no data is shown even though I read through a lot of posts on here. In the following I will describe what I did:
1) Created a new Project and put the chart onto the 2D Canvas.
2) Under External Data I imported the Car1 Thing and the Service GetPropertyValue and QueryPropertyHistory.
3) Under QueryPropertyHistory I attached "All Items" to the chart on my Canvas and selected "Data" for Select Binding Target.
4) Under Configuration I selected "Invoke On Startup" and "Auto-refresh". I did the same on GetPropertyValues.
5) For the chart I selected "timestamp" on the X-axis and "RPM" on the Y-axis.
When I'm in the Composer I can't test the Services because I'm using a Trial-Account.
The Bar Chart and Gauge work just fine.
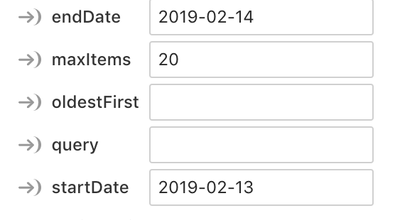
I played around with the Parameters which looked like this:
I also played around with the Event "ServiceInvokeComplete" but no luck as well. Somehow I made the Time Series Chart work with the "GetPropertyValue" only, but this was not what I wanted and the chart displayed, but incorrect.
For any help regarding this topic I would be very grateful, this is the last step to finish my Project.
Best regards 🙂
Solved! Go to Solution.
- Labels:
-
Best Practices
Accepted Solutions
- Mark as New
- Bookmark
- Subscribe
- Mute
- Subscribe to RSS Feed
- Permalink
- Notify Moderator
Here some picture to my previous replay , so hope it make it more clear
1.) in the design mode
And then the display when testing it in preview mode:
- Mark as New
- Bookmark
- Subscribe
- Mute
- Subscribe to RSS Feed
- Permalink
- Notify Moderator
Hi @DanielPi,
so far I understand your problem you want to call the QueryPropertyHistory service with parameters so to select a specific data inside some parameter range.
If it is not caused on some restiction on your trial instance- so passing the parameters to the service - this should work fine.
So you have to :
1.) bind the all data of the QueryPropertyHistory service to the data of the Time Series Chart widget
2.) second point is to call the service / for example by clicking of a button , where you will pass also the parameters (for example via binding of Text Input values directly to the service parameters) . I tested only using one parameter/severice argument - "maxItems" to reduce the resulst set - to be sure that there is no some mistake by the passed parmeter values /some values which will not find data
3.) Bind ServiceInvoceComplete Event of the QueryPropertyHistory service to the update Chart service of the time Series Chart widget
So this will have the effect that when you change the parameter maxItems e.g via Text Input Widget and then call teh service QueryPropertyHistory - in this case the Time Series Chart widget will display only number of data points which is specified by the value of the "maxItems" parameter
- Mark as New
- Bookmark
- Subscribe
- Mute
- Subscribe to RSS Feed
- Permalink
- Notify Moderator
Here some picture to my previous replay , so hope it make it more clear
1.) in the design mode
And then the display when testing it in preview mode:
- Mark as New
- Bookmark
- Subscribe
- Mute
- Subscribe to RSS Feed
- Permalink
- Notify Moderator
Thank you!


