Community Tip - Visit the PTCooler (the community lounge) to get to know your fellow community members and check out some of Dale's Friday Humor posts! X
- Subscribe to RSS Feed
- Mark Topic as New
- Mark Topic as Read
- Float this Topic for Current User
- Bookmark
- Subscribe
- Mute
- Printer Friendly Page
Create a 3-D plot of a function with two variable
- Mark as New
- Bookmark
- Subscribe
- Mute
- Subscribe to RSS Feed
- Permalink
- Notify Moderator
Create a 3-D plot of a function with two variable
Hello All,
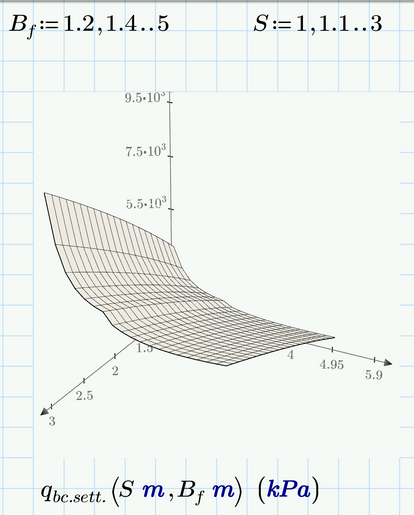
I am trying to generate a 3-D plot for a function. I am having the following issue.
Please help.
Solved! Go to Solution.
- Labels:
-
Mathcad Usage
-
Programming
Accepted Solutions
- Mark as New
- Bookmark
- Subscribe
- Mute
- Subscribe to RSS Feed
- Permalink
- Notify Moderator
- Mark as New
- Bookmark
- Subscribe
- Mute
- Subscribe to RSS Feed
- Permalink
- Notify Moderator
Requires long time to make plot.
- Mark as New
- Bookmark
- Subscribe
- Mute
- Subscribe to RSS Feed
- Permalink
- Notify Moderator
Thank you @ttokoro . What is purpose of using third brackets " [ ]". Is this for assigning the matrix values in each corresponding cells inside the "Ans"
- Mark as New
- Bookmark
- Subscribe
- Mute
- Subscribe to RSS Feed
- Permalink
- Notify Moderator
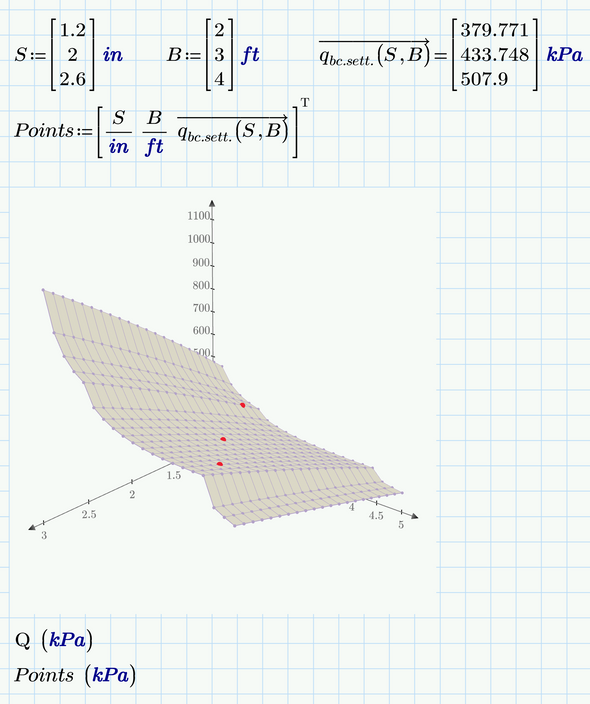
Your sheet shows error mesage for x and y data must have no unit. So I make Ans as [x y z-value with unit].
And stack all S and Df and its Ans.
I try to use [NaN NaN NaN] to stack. In this plot, z axis also has no unit.
- Mark as New
- Bookmark
- Subscribe
- Mute
- Subscribe to RSS Feed
- Permalink
- Notify Moderator
@ttokoro thank you. why was "not a number (NaN)" required for stacking...should not it be stacked by itself without using NaN. Please help
- Mark as New
- Bookmark
- Subscribe
- Mute
- Subscribe to RSS Feed
- Permalink
- Notify Moderator
Instead of point data, [NaN NaN NaN] turn off to connect each 3D point [x y z] data by stacking.
- Mark as New
- Bookmark
- Subscribe
- Mute
- Subscribe to RSS Feed
- Permalink
- Notify Moderator
In fact, the error message reveals the cause and also gives the hint to the solution of the problem:
The variables for the independent variables (x, y) must (unfortunately) be unitless. Only the dependent variable (z), i.e. the function result, may have a unit.
So omit the unit meter at the range variables and add them when calling the function.
The plot takes "endless" to finish because the function seems to be defined quite inefficient.
You sure should consider to implement the improvement I suggested in another thread of yours which at least speeds up the calculation for the factor 5.
Personally I would prefer using CreateMesh() instead of range variables
- Mark as New
- Bookmark
- Subscribe
- Mute
- Subscribe to RSS Feed
- Permalink
- Notify Moderator
- Mark as New
- Bookmark
- Subscribe
- Mute
- Subscribe to RSS Feed
- Permalink
- Notify Moderator
- Mark as New
- Bookmark
- Subscribe
- Mute
- Subscribe to RSS Feed
- Permalink
- Notify Moderator
Also, I am having the following image using your process @Werner_E . The box was marked "red". Please help
- Mark as New
- Bookmark
- Subscribe
- Mute
- Subscribe to RSS Feed
- Permalink
- Notify Moderator
And the error message is?
As far as I see your comp is still computing......
Personally I would prefer using the CreateMesh() function anyway
File (Prime9) with a speedier function attached
- Mark as New
- Bookmark
- Subscribe
- Mute
- Subscribe to RSS Feed
- Permalink
- Notify Moderator
Wish I I had 9 but unfortunately, mine is 7
- Mark as New
- Bookmark
- Subscribe
- Mute
- Subscribe to RSS Feed
- Permalink
- Notify Moderator
I guess it should work as well in P7. P9 is not really a huge step forward (sure not worth any money).
It takes very long to calculate, even if you apply the speed up modification I explained in the other thread of yours.
Here is the speed-up again as used in the current sheet of yours:
Mind the vectorization!
- Mark as New
- Bookmark
- Subscribe
- Mute
- Subscribe to RSS Feed
- Permalink
- Notify Moderator
how do I get "CreateMesh" function
- Mark as New
- Bookmark
- Subscribe
- Mute
- Subscribe to RSS Feed
- Permalink
- Notify Moderator
@fahmed-2 wrote:
how do I get "CreateMesh" function
Its a standard function in Prime. Its sure available in your Prime7 as well.
I guess it was even implemented in the very first Prime version 😉 The 3D plot has not improved since then.
But maybe @LucMeekes is able and willing to convert my attached sheet for you in Prime 7 format - he has found a way to do so and is able to do.
- Mark as New
- Bookmark
- Subscribe
- Mute
- Subscribe to RSS Feed
- Permalink
- Notify Moderator
- Mark as New
- Bookmark
- Subscribe
- Mute
- Subscribe to RSS Feed
- Permalink
- Notify Moderator
Q is a nested vector containing matrices for the x, y and z values of the points to be plotted.
If you need the value for a specific S and B.f value, simply use the original function to get it, not Q.
And if your goal is to highlight some specific positions in the 3D plot, you could do it as shown here
Actually I don't understand why you refuse to speed up your function calculation as already shown.
- Mark as New
- Bookmark
- Subscribe
- Mute
- Subscribe to RSS Feed
- Permalink
- Notify Moderator
- Mark as New
- Bookmark
- Subscribe
- Mute
- Subscribe to RSS Feed
- Permalink
- Notify Moderator
- Mark as New
- Bookmark
- Subscribe
- Mute
- Subscribe to RSS Feed
- Permalink
- Notify Moderator
- Mark as New
- Bookmark
- Subscribe
- Mute
- Subscribe to RSS Feed
- Permalink
- Notify Moderator
- Mark as New
- Bookmark
- Subscribe
- Mute
- Subscribe to RSS Feed
- Permalink
- Notify Moderator
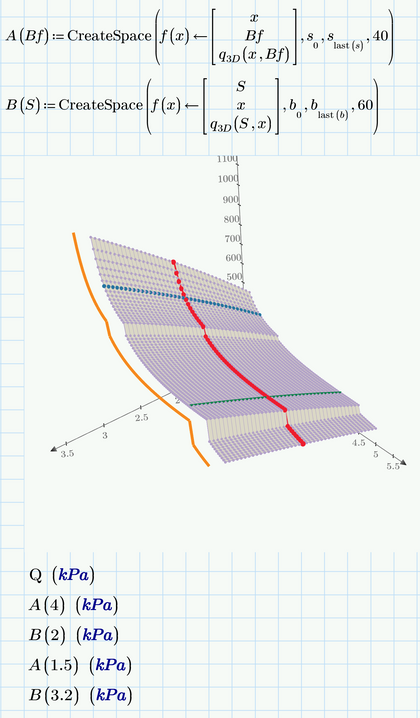
Can alternatively be achieved using CreateSpace()
May be formatted with lines and/or points. Unfortunately Prime provides only one size which is equally valid for points and lines. Workaround would be to use two plot traces 😞
- Mark as New
- Bookmark
- Subscribe
- Mute
- Subscribe to RSS Feed
- Permalink
- Notify Moderator
Thank you @Werner_E . This is awesome!! Please advise as why did you put numbers 40 and 60 for defining A and B, respectively.
- Mark as New
- Bookmark
- Subscribe
- Mute
- Subscribe to RSS Feed
- Permalink
- Notify Moderator
@fahmed-2 wrote:
Thank you @Werner_E . This is awesome!! Please advise as why did you put numbers 40 and 60 for defining A and B, respectively.
Just to get a finer resolution. Default value would be 20 if you omit this parameter (see the help info for CrreateSpace() and also for CreateMesh() ).
As you can see in the picture I also used a finer grid for the surface, too, to et a bit more details. It takes longer to calculate, but as I implemented the already mentioned speedier function we can wait for it to finish.
- Mark as New
- Bookmark
- Subscribe
- Mute
- Subscribe to RSS Feed
- Permalink
- Notify Moderator
Salute!!


