- Subscribe to RSS Feed
- Mark Topic as New
- Mark Topic as Read
- Float this Topic for Current User
- Bookmark
- Subscribe
- Mute
- Printer Friendly Page
Finding maximum value of a chart
- Mark as New
- Bookmark
- Subscribe
- Mute
- Subscribe to RSS Feed
- Permalink
- Notify Moderator
Finding maximum value of a chart
Hello,
I am having trouble finding the maximum value of the functions x(t) y(t) and theta(t). I have attached my workbook I assumed this would be easy but I am unable to find a simple way to do this. Any help would be greatly appreciated.
Solved! Go to Solution.
- Labels:
-
Math Homework
Accepted Solutions
- Mark as New
- Bookmark
- Subscribe
- Mute
- Subscribe to RSS Feed
- Permalink
- Notify Moderator
- Mark as New
- Bookmark
- Subscribe
- Mute
- Subscribe to RSS Feed
- Permalink
- Notify Moderator
- Mark as New
- Bookmark
- Subscribe
- Mute
- Subscribe to RSS Feed
- Permalink
- Notify Moderator
Thank you very much.
- Mark as New
- Bookmark
- Subscribe
- Mute
- Subscribe to RSS Feed
- Permalink
- Notify Moderator
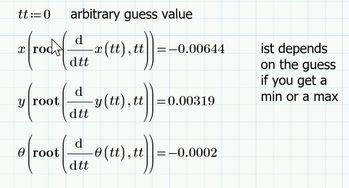
Another way, since you have functions:
Take the derivative,
Find the root of the derivative,
Evaluate the function at that root.
See attached, works in express.
- Mark as New
- Bookmark
- Subscribe
- Mute
- Subscribe to RSS Feed
- Permalink
- Notify Moderator
For whatever it may be worth here are my 2 Cents
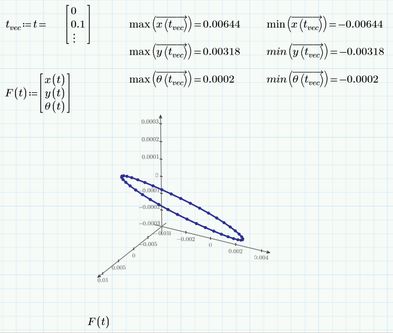
1) an approach using a vector but utilizing the OPs already defined range for t and vectorization. Also a nice 3D plot using the three functions.
2) an analytic approach using root with a guess value (so you don't have to look at the plot to find two t-values where the function values have opposite sign.
Getting an analytic solution using the symbolics only works with legacy symbolic (muPad). The new symbolic (FriCAS) seems to be not able to find a solution (or I was to inpatient - I cancelled the calculation after a while).
Of course we would have to assign the result to a variable and evaluate x(t) at this position to get the amplitude.


