Community Tip - Learn all about PTC Community Badges. Engage with PTC and see how many you can earn! X
- Subscribe to RSS Feed
- Mark Topic as New
- Mark Topic as Read
- Float this Topic for Current User
- Bookmark
- Subscribe
- Mute
- Printer Friendly Page
Help with "complicated" Interpolation
- Mark as New
- Bookmark
- Subscribe
- Mute
- Subscribe to RSS Feed
- Permalink
- Notify Moderator
Help with "complicated" Interpolation
Hello everyone,
I need help please to derive the following function:
This function shows different curves (0,5 Layer ... 10 Layer).
The X- and Y- axis are not linear. I divided both axis into 5 sections. For each curve I have take some data points for each section.
I am seeking this final graph:
The datapoints for the different curves are attached.
How can I recreate these datapoints as a function, like in the graph shown above?
For each section I have to interpolate with spline functions?
Then I do need a "if... if else ... else" command to check which section is active?
Attention, the Sheet is Mathcad Prime 6
Kind regards
- Labels:
-
Algebra_Geometry
-
Mathcad Usage
-
Programming
- Mark as New
- Bookmark
- Subscribe
- Mute
- Subscribe to RSS Feed
- Permalink
- Notify Moderator
> Attention, the Sheet is Mathcad Prime 6
No, its not! Its in Prime 7 format!
- Mark as New
- Bookmark
- Subscribe
- Mute
- Subscribe to RSS Feed
- Permalink
- Notify Moderator
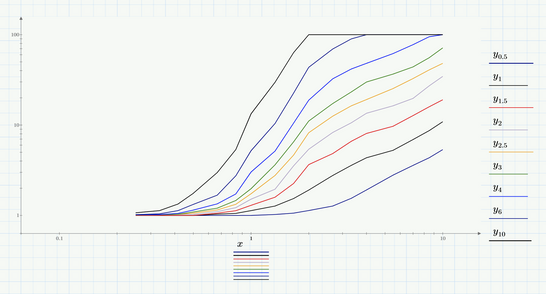
Here is one first attempt:
Here the raw data are plotted (just the data points connected by line segments). If you'd like it smoother or if you need functions to calculate intermediate values, you may either try some sort of linear (not smoother) or spline interpolation or even give curve fitting (regressions) a try.
Note the formatting options for Primes native plots are very limited. You may give the built-in third party diagram component a try. It offers more formatting options but has some severe limitations and drawbacks which is the reason I don't/can't use it.
Worksheet in Prime 6 (really!) format attached.
- Mark as New
- Bookmark
- Subscribe
- Mute
- Subscribe to RSS Feed
- Permalink
- Notify Moderator
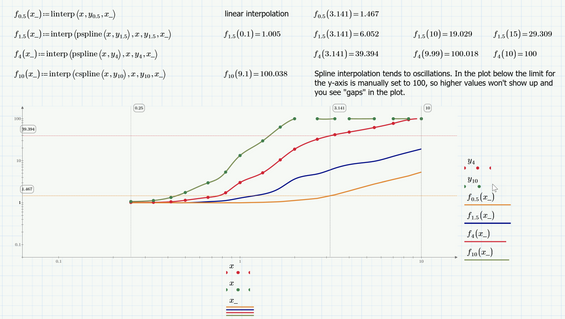
If you want to use interpolation, you would have to delete the last data line in each section but the last one because the very same data is repeated as first line of the next section and the interpolation functions don't like repeated values in its vector of x-values.
After deleting those rows, you could use linear or spline (lspline, pspline or cspline) interpolation as shown below:
Worksheet in P6 format attached
- Mark as New
- Bookmark
- Subscribe
- Mute
- Subscribe to RSS Feed
- Permalink
- Notify Moderator
Hello Werner,
Thank you very much!
Just informative for me:
In Excel it's possible to create a trendline for each section and to retrieve a possible function (n-th order). With this approach I could use the "genfit" function afterwards. (I saw similar approaches in this forum). What is the difference between genfit and spline or cspline?
- Mark as New
- Bookmark
- Subscribe
- Mute
- Subscribe to RSS Feed
- Permalink
- Notify Moderator
What is the difference between genfit and spline or cspline?
An interpolation (spline, linear or any other) is running exactly through all you data points and connects them piecewise with functions.
A regression (fit) is a function of a specific type whose parameters are chosen so that it fits best. This means that normally a fit function would not include one single of your data points but. Best fit usually means that the sum of the squared errors is minimized. Best known may be the linear regression - finding a linear function which "fits" your data points best to read a trend, for example.
Its up to you to provide a function type which you think makes a good fit and then "genfit" could calculate the optimal parameters - this may also depend on the guess values you provide.
If you think that a polynomial of third order is a good choice, you can use f(x,a,b,c,d):=a*x^3+b*c^2+c^x+d and let genfit find good arguments a,b,c and d. For polynomial fits Mathcad provides an separate function "polyfit". There are also a couple of other special regression function like expfit, logfit and others. You may look them up in the help section about curve fitting.
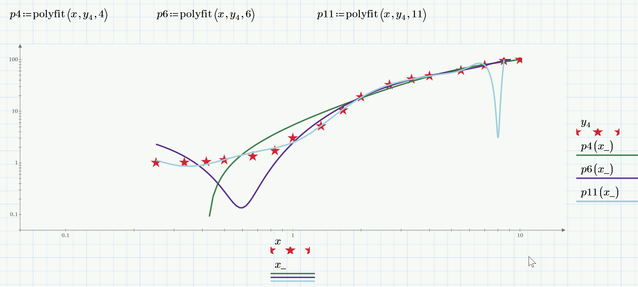
Here are two fits. One with kind of a root function, which obviously is not a good choice especially for lower values of x, and the other a simple polynomial of 8th order, which may have other drawbacks.
For choosing a good function type for the fit it may help a lot to knowing something about the process the data stems from.
Here are some more polynomial fits which sure are not good enough - higher order tend to oscillation.
- Mark as New
- Bookmark
- Subscribe
- Mute
- Subscribe to RSS Feed
- Permalink
- Notify Moderator
I like your first attempt best, Werner. xyz123's problem is not enough data, not noisy data that should be smoothed or regressed. Smoothing attempts in this situation seem to me be to be "trying to turn lead into gold".
- Mark as New
- Bookmark
- Subscribe
- Mute
- Subscribe to RSS Feed
- Permalink
- Notify Moderator
@rgunwaldsen wrote:
I like your first attempt best, Werner. xyz123's problem is not enough data, not noisy data that should be smoothed or regressed. Smoothing attempts in this situation seem to me be to be "trying to turn lead into gold".
I agree and if xyz123 really needs a function to calculate intermediate values, linear interpolation seems to be all that's needed.
But if he knows that his data stems from a process which follows a know (theoretical) function type, it sure makes sense to try a fit and determine the necessary parameters.
We don't know what he really needs - if he just want to duplicate a plot picture given in a book or if he intends to do further work.
But spline interpolation or fitting an arbitrary function type like a polynomial sure is more like corrupting data than being helpful, I guess. I just showed how to do a polynomial fit as he mentioned doing something similar in Excel.
@xyz123
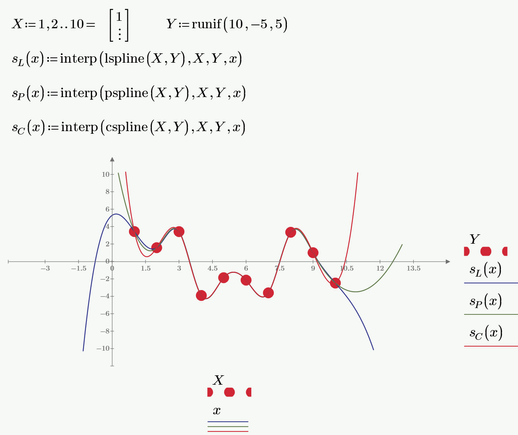
I just noticed that I answered your question about regression/fitting vs. interpolation but not the one concerning splines/cspline. So here goes: A spline interpolation uses cubic functions between every two points which join by having the same tangent and curvature at the joint points. Prime offers these cubic splines in three flavors - lspline, pspline, cspline. All of them interpolate with cubics, the difference is only how the end points are handled.
- Mark as New
- Bookmark
- Subscribe
- Mute
- Subscribe to RSS Feed
- Permalink
- Notify Moderator
I agree with your comment on linear interpolation versus smoothing/regression/curve fitting.
xyz123 needs better/more data. The data point in the figure looks obviously wrong; but correcting it requires additional surrounding data upon which a reasonable correction can be made (probably here via regression).
- Mark as New
- Bookmark
- Subscribe
- Mute
- Subscribe to RSS Feed
- Permalink
- Notify Moderator
Your curves remind me of the Raimondi & Boyd curves used for fluid film bearing Sommerfeld number design. The authors had 4 curves and an interpolation function. You'd solve 'y' for each line for a given an 'x' and then interpolate for your known bearing L/D ratio. I know that doesn't answer your question but someone will find it interesting and a similar approach should work. I just don't know how they derived their interpolation function.


