
Turn on suggestions
Auto-suggest helps you quickly narrow down your search results by suggesting possible matches as you type.
Showing results for
Please log in to access translation
Turn on suggestions
Auto-suggest helps you quickly narrow down your search results by suggesting possible matches as you type.
Showing results for
Community Tip - Visit the PTCooler (the community lounge) to get to know your fellow community members and check out some of Dale's Friday Humor posts! X
Translate the entire conversation x
Please log in to access translation
Options
- Subscribe to RSS Feed
- Mark Topic as New
- Mark Topic as Read
- Float this Topic for Current User
- Bookmark
- Subscribe
- Mute
- Printer Friendly Page
Problem in plotting graph in Mathcad 15
Oct 19, 2011
02:54 AM
- Mark as New
- Bookmark
- Subscribe
- Mute
- Subscribe to RSS Feed
- Permalink
- Notify Moderator
Please log in to access translation
Oct 19, 2011
02:54 AM
Problem in plotting graph in Mathcad 15
Hi,
I have data sheet created in Mathcad 2000 which is an array.
If I try to open it in Mathcad 15, the graph plotted in 2000 is not working.
Is it a bug? I have no go, have to work with Mathcad 15. Kindly suggest a solution.
--
Dhinesh
Solved! Go to Solution.
Labels:
- Labels:
-
Statistics_Analysis
ACCEPTED SOLUTION
Accepted Solutions
Oct 19, 2011
09:04 AM
- Mark as New
- Bookmark
- Subscribe
- Mute
- Subscribe to RSS Feed
- Permalink
- Notify Moderator
Please log in to access translation
Oct 19, 2011
09:04 AM
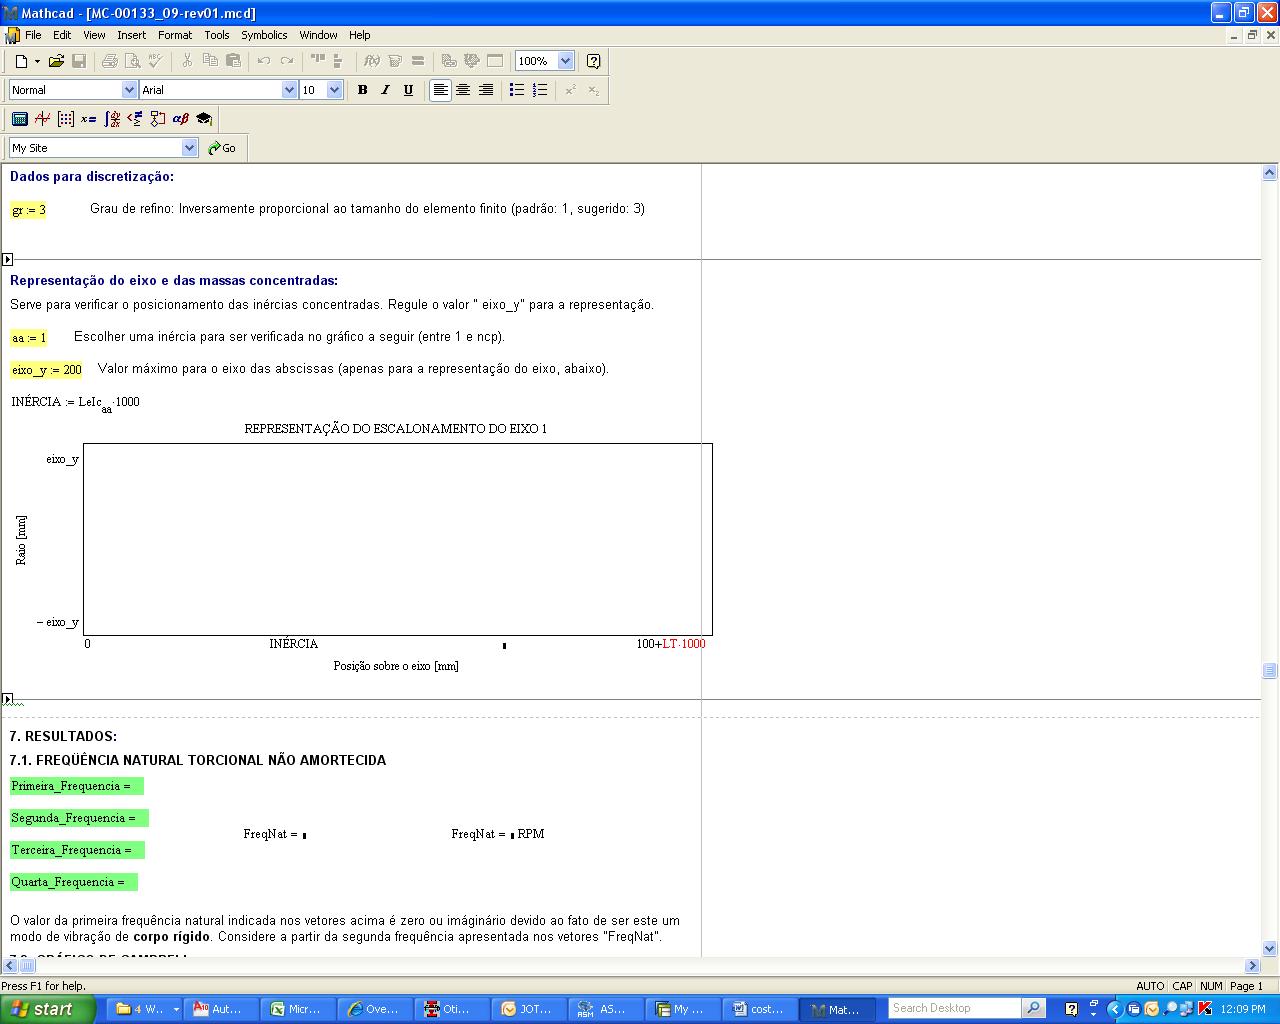
There is still a problem lower down the file in Vladimir's version. There is a line where G is assigned to Gi that doesn't seem to be useful, but just slows everything down. In the plots, you need to assign units to the 100 in the last term on the x-axis (as I've done) or remove units from the other term (as Vladimir has done).
Alan
8 REPLIES 8
Oct 19, 2011
04:30 AM
- Mark as New
- Bookmark
- Subscribe
- Mute
- Subscribe to RSS Feed
- Permalink
- Notify Moderator
Please log in to access translation
Oct 19, 2011
04:30 AM
Please post the Mathcad 2000 worksheet.
Alan
Oct 19, 2011
05:32 AM
- Mark as New
- Bookmark
- Subscribe
- Mute
- Subscribe to RSS Feed
- Permalink
- Notify Moderator
Please log in to access translation
Oct 19, 2011
05:32 AM
Alan,
I can send you a screen shot of the sheet considering confidentiality issues.
Sheet is not in English, its in Portugese language.
--
Dhinesh
Oct 19, 2011
05:46 AM
- Mark as New
- Bookmark
- Subscribe
- Mute
- Subscribe to RSS Feed
- Permalink
- Notify Moderator
Please log in to access translation
Oct 19, 2011
05:46 AM
I was going to load the worksheet into an earlier version of Mathcad (like 11 and 13) and see if the problem occurred there. Can't tell from the screenshot so I'm no help here I'm afraid - sorry!
Alan
Oct 19, 2011
06:16 AM
- Mark as New
- Bookmark
- Subscribe
- Mute
- Subscribe to RSS Feed
- Permalink
- Notify Moderator
Please log in to access translation
Oct 19, 2011
06:16 AM
Without a worksheet it will be impossible to find a solution. Can you try and replicate the problem?
Mike
Oct 19, 2011
06:52 AM
- Mark as New
- Bookmark
- Subscribe
- Mute
- Subscribe to RSS Feed
- Permalink
- Notify Moderator
Please log in to access translation
Oct 19, 2011
08:04 AM
- Mark as New
- Bookmark
- Subscribe
- Mute
- Subscribe to RSS Feed
- Permalink
- Notify Moderator
Please log in to access translation
Oct 19, 2011
08:20 AM
- Mark as New
- Bookmark
- Subscribe
- Mute
- Subscribe to RSS Feed
- Permalink
- Notify Moderator
Please log in to access translation
Oct 19, 2011
08:20 AM
We can point in Mathcad 2000 on the plot axes: from 1000 to 2000 for example.
Now we must point in Mathcad 15 on the plot axes: from 1000 m to 2000 m (with units!) for example.
I think the error is here.
Oct 19, 2011
09:04 AM
- Mark as New
- Bookmark
- Subscribe
- Mute
- Subscribe to RSS Feed
- Permalink
- Notify Moderator
Please log in to access translation
Oct 19, 2011
09:04 AM
There is still a problem lower down the file in Vladimir's version. There is a line where G is assigned to Gi that doesn't seem to be useful, but just slows everything down. In the plots, you need to assign units to the 100 in the last term on the x-axis (as I've done) or remove units from the other term (as Vladimir has done).
Alan


