- Subscribe to RSS Feed
- Mark Topic as New
- Mark Topic as Read
- Float this Topic for Current User
- Bookmark
- Subscribe
- Mute
- Printer Friendly Page
Return (several) plots programmatically
- Mark as New
- Bookmark
- Subscribe
- Mute
- Subscribe to RSS Feed
- Permalink
- Notify Moderator
Return (several) plots programmatically
Hi!
Is it possible to return a plot in MC15 from a progam?
Background:
I have multiple excel files with data.
Using the READEXCEL i want to take the data for each file and plot a fitted curve (polyfit(X,Y,2)) for each file
I cannot find any commands to output a plot
Regards
Siggi
Solved! Go to Solution.
- Labels:
-
Programming
Accepted Solutions
- Mark as New
- Bookmark
- Subscribe
- Mute
- Subscribe to RSS Feed
- Permalink
- Notify Moderator
Mathcad is not Matlab. That is: it is not a programming language.
Inserting a plot on a worksheet can only be done by user (interface) action.
What you can do is insert a plot, and adapt it to your needs. Then copy it as many times as you need on the worksheet and feed each plot with data from a file source (data file, excel file, whatever), by just changing the file name. That should work fine if all your file sources are structured similarly (if not equally).
Success!
Luc
- Mark as New
- Bookmark
- Subscribe
- Mute
- Subscribe to RSS Feed
- Permalink
- Notify Moderator
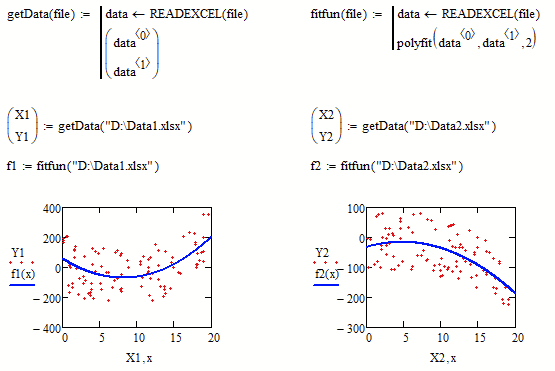
In Mathcad a plot is not an object which can be stored in a variable or can be the result of a function.
But you sure can write a program which takes the Excel file name and returns the desired function.
Not sure if the following example comes close to what you are looking for:
- Mark as New
- Bookmark
- Subscribe
- Mute
- Subscribe to RSS Feed
- Permalink
- Notify Moderator
Thank you @Werner_E and @LucMeekes !
Quick follow-up regarding plots:
Is it possible to link the plot title to e.g. a vector containing the name of the files?
So when I enter a new list of excel filenames, the plot titles would automatically update
Regards
Siggi
- Mark as New
- Bookmark
- Subscribe
- Mute
- Subscribe to RSS Feed
- Permalink
- Notify Moderator
Quick answer: No.
The plot title is not a variable accessible from within mathcad. It, like the rest of the plot, can only be entered through the user interface.
What you can do is, if the file name is a (string) variable, evaluate that variable above or on top of the plot.
Success!
Luc
- Mark as New
- Bookmark
- Subscribe
- Mute
- Subscribe to RSS Feed
- Permalink
- Notify Moderator
As Luc already wrote you can't control those settings via worksheet variables.
An alternative to placing regions with evaluated variables to show filenames alongside the plot is, to place scripted textboxes above the plots. You have control over font size, color etc. that way.
When you open the attached worksheet you have to click "No" to allow the script to run.


