Community Tip - Did you get an answer that solved your problem? Please mark it as an Accepted Solution so others with the same problem can find the answer easily. X
- Subscribe to RSS Feed
- Mark Topic as New
- Mark Topic as Read
- Float this Topic for Current User
- Bookmark
- Subscribe
- Mute
- Printer Friendly Page
Plot impact factor vs. [h/ delta static]
- Mark as New
- Bookmark
- Subscribe
- Mute
- Subscribe to RSS Feed
- Permalink
- Notify Moderator
Plot impact factor vs. [h/ delta static]
Hello,
In the attached sheet, I want to plot Impact factor vs [h/delta static] but unable to. I am sure there is an easier and better way than i did so far. i saved the file as Mathcad 11.
Thanks,
Sam
Solved! Go to Solution.
- Labels:
-
Programming
Accepted Solutions
- Mark as New
- Bookmark
- Subscribe
- Mute
- Subscribe to RSS Feed
- Permalink
- Notify Moderator
Your "red" plot won't work because h/delta_static is a range variable, and you need to have something on the y-axis that also uses it before Mathcad will plot it.
I know this answer is in Mathcad Prime Express 7, but I *think* the methods should work in M11..M15.
Not sure whether (having defined impactfactor as above) the following will work in M11..M15.
Stuart
- Mark as New
- Bookmark
- Subscribe
- Mute
- Subscribe to RSS Feed
- Permalink
- Notify Moderator
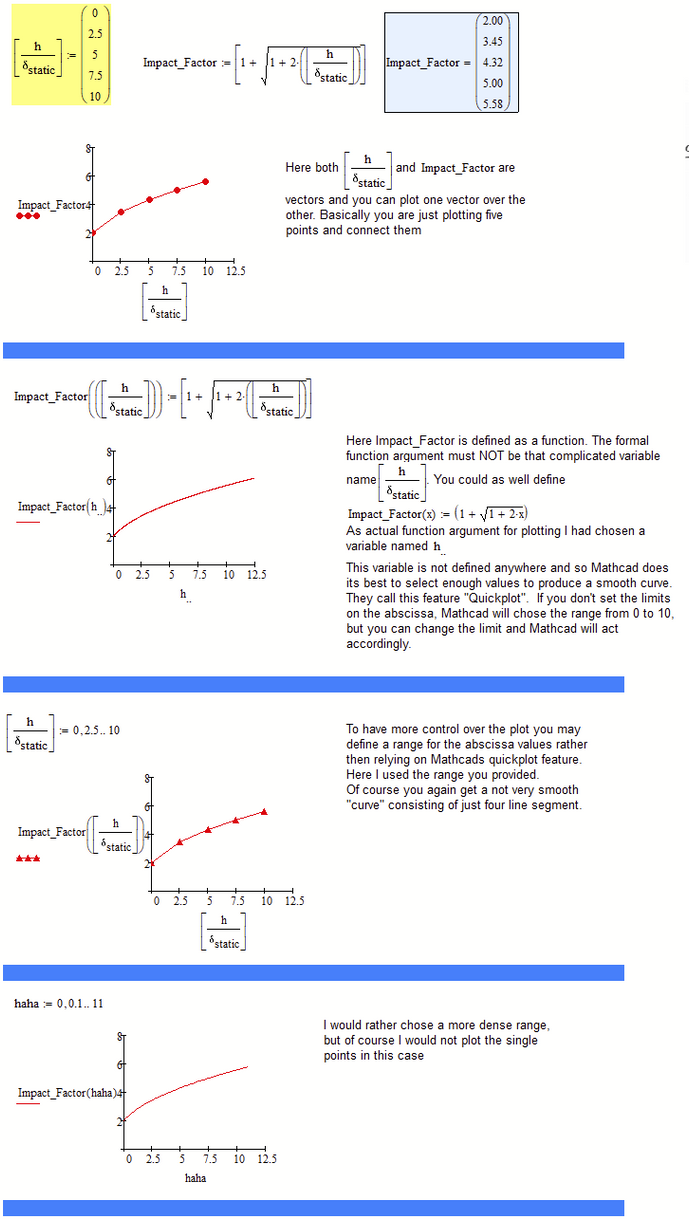
You define h/delta as a vector in the forst line, but redefine it as a range in the second. Then you try to plot the vector "Impact" over that range, which does not work. You can plot a vector over another vector or use a range in combination with a function.
See the examples:
Mathcad 11 worksheet attached
- Mark as New
- Bookmark
- Subscribe
- Mute
- Subscribe to RSS Feed
- Permalink
- Notify Moderator
Thank you So much for your detailed answer Werner! I always struggle with vector and range definitions and I get them mixed up.
Sam
- Mark as New
- Bookmark
- Subscribe
- Mute
- Subscribe to RSS Feed
- Permalink
- Notify Moderator
Your "red" plot won't work because h/delta_static is a range variable, and you need to have something on the y-axis that also uses it before Mathcad will plot it.
I know this answer is in Mathcad Prime Express 7, but I *think* the methods should work in M11..M15.
Not sure whether (having defined impactfactor as above) the following will work in M11..M15.
Stuart
- Mark as New
- Bookmark
- Subscribe
- Mute
- Subscribe to RSS Feed
- Permalink
- Notify Moderator
Thank you so much Stuart!
Sam
- Mark as New
- Bookmark
- Subscribe
- Mute
- Subscribe to RSS Feed
- Permalink
- Notify Moderator


