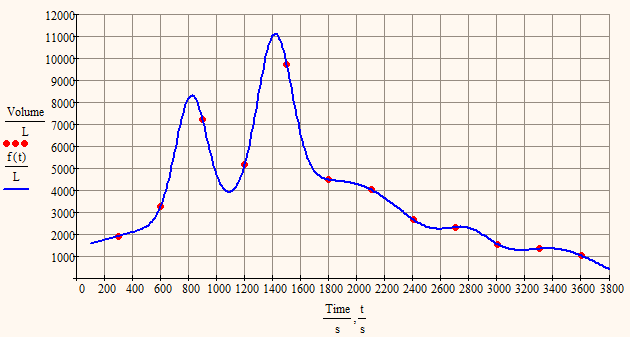
I played around a bit with your data and found a sum of 6 Gaussians which fit pretty well.
I didn't use genfit() but minerr() as the results will be the same and with minerr() the whole thing is better managable. I used Mathcad 15 for this because that version is much more user friendly and and quicker reacting and converted the sheet later in P3 format - just in case you are wondering why the datavectors are defined in a different way.
You may play around with the number of summands and the guess value and i think you will get good fits with less summands, too. But you will notice that the fit is VERY sensible wrt the guess values (just change the top left 1010 in Matrix M to 1020 or to 1000 and see yourself).
I'm not sure but I guess you'll like the splined f1 in my last post more.
But as you wrote that the data is synthetic hydrograph I would imagine that the other two regressions in my previous post are describuig the event more realistic as they don't follow every peak and valley.