1-Visitor
November 19, 2015
Question

PTC CREO SIMULATE THERMAL STEADY

  • November 19, 2015
  • 1 reply
  • 4224 views

Hi all, my name is Gorka Garcia... I work by Integral PLM Experts, Partner PTC Spain

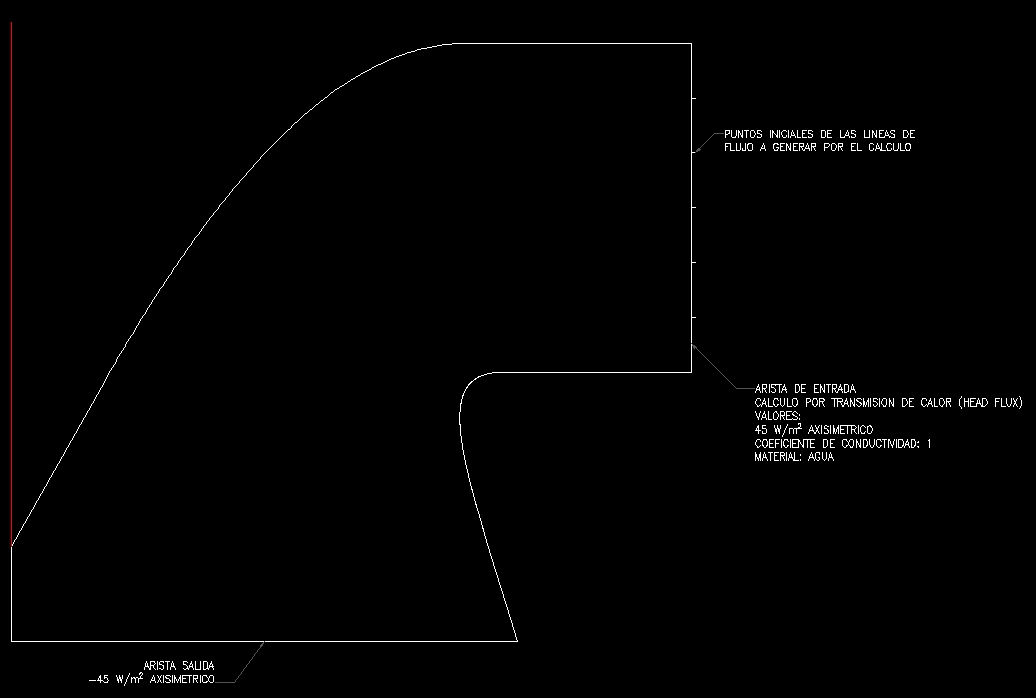
I've a customer that ask me about Thermal Analysis axisymmetric

I've the load input (Vertical Line 45 W/m^2) and output (Horizontal Line -45 W/m^2)

The constraints temperature is 25ΒΊC

The material is water... Then the properties of water for Coef. Poisson and Young Module are similar to Steel ( a small cheat )

surface_water.jpg

The result of Flux (W/m^2) is this.... initial in yellow curve zone and finished in output horizontal line... when should begin in input vertical line and continue to output horizontal line.

results_1.jpg

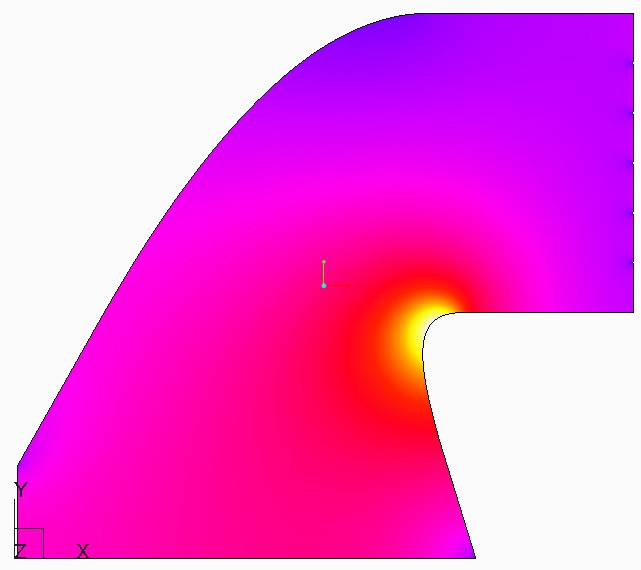
Also I should get the curves that go from line input to line output... as example this image of customer.

Clipboard01.jpg

Who can you help me?

Thanks.

BR

Gorka Garcia


This thread is inactive and closed by the PTC Community Management Team. If you would like to provide a reply and re-open this thread, please notify the moderator and reference the thread. You may also use "Start a topic" button to ask a new question. Please be sure to include what version of the PTC product you are using so another community member knowledgeable about your version may be able to assist.

1 reply

13-Aquamarine
November 19, 2015

Does this help?

ggarcia1-VisitorAuthor
1-Visitor
November 19, 2015

Hello Mr Charles

Not Exactly, but I believed which direction flux began in yellow corner... now I see that the direction flux is correct.

I need to get the "curves" 2D from input to output. These "2D" curves are to design the 3D model.

Thanks... I hope can you help me.... or other colleagues too.

BR,

Gorka

13-Aquamarine
November 20, 2015

Gorka,

I understand. I don't think it's possible. Does anyone else have any thoughts?

You want the temperature 'streamlines'.

Each of these streamlines can start from an arbitrary point on the vertical heat input line. At the vertical heat input line they must be vectors normal to the vertical line.

These streamlines are normal to the iso-temperature contours shown below :

The vector plot and this is as close as we get.

But also, there is no way to output the curves as useful geometry.

It would be possible to write code to look at the results files and create output a table of x-y values for a datum point array to create datum curves.

Have a good weekend