1-Visitor
November 14, 2013
Solved

Colors on contour plots showing wrong.

  • November 14, 2013
  • 4 replies
  • 24827 views

Hello all,

I am totally buffled by what I get on my contour plots.

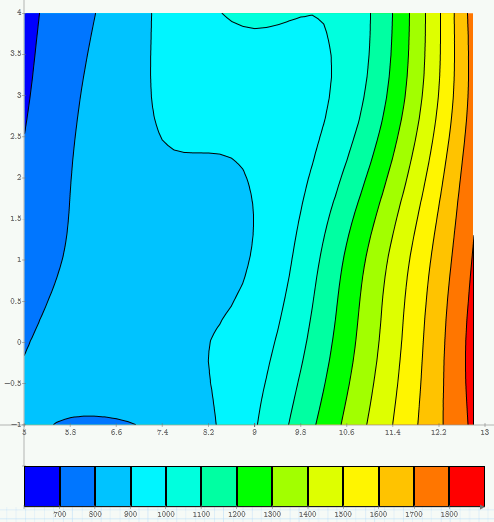
I have attached the file. In the file I have also included a picture from the Excel contour plot which proves that the Mathcad plots are wrong.

Basically I have the 3 vectors defined as matrices, x, y ans z and I create the 3d matrix based on the procedure I came across on a similar plot related discussion thread of this forum.

The contour lines on the plot I create appear correct but the colours are plotted wrong. I think that the problem is that two different bands have the same colour(!) but should have different ones based on the legend underneath. This doesn't make any sense. Before I totally give up on this and continue my work in Excel I wanted to submit this question in the forum.

Also, a separate -less critical- question: is there any chance that I can have axis titles on my plots, instead of having to put text blocks all over...

Any help is appreciated,

Thanks,

Panos

Best answer by Werner_E

As the way you constructed the matrices X and Y crashes Mathcad on some installations (see above: http://communities.ptc.com/message/226620#226620) I created X and Y in a different way an now no problems are experienced. Of course the colours Mathcad shows still are wrong.

I added a simple 2D linear interpolation of your data and now Mathcad is showing the colors as we had excpected (despite the fact the the colors chosen are somewhat unskilled, especially the different shades of cyan). Nevertheless the Excel result still is prettier 😉

I would have thought that Mathcad would do that kind of interpolation itselft if told to plot the contours of a matrix rather than a function.

The attached file is in Prime2 format.

ContourPlot10kn_2.png

4 replies

25-Diamond I
November 14, 2013

The highest z-value is 1825. You could try changing the upper limit in the band from 1900 to 1800.

Unfortunately when I tried to do this, Mahcad crashes (Prime3 as well as Prime2).

Also, a separate -less critical- question: is there any chance that I can have axis titles on my plots, instead of having to put text blocks all over...

Unfortunately not in Prime. The problem may be adressed in a future release we were told.

EDIT: In case anybody has an idea what the problem could be, the error message in a console window before/after the crash is:

OMP: Warning #2: Cannot open message catalog "3079\libiomp5ui.dll":

OMP: System error #126: Das angegebene Modul wurde nicht gefunden.

OMP: Info #3: Default messages are used.

OMP: Error #13: Assertion failure at z_Windows_NT_util.c(426).

OMP: Hint: Please submit a bug report with this message, compile and run command

s used, and machine configuration info including native compiler and operating s

ystem versions. Faster response will be obtained by including all program source

s. For information on submitting this issue, please see http://www.intel.com/sof

tware/products/support/.

1-Visitor
November 14, 2013

Hi Werner, many thanks for your time.

I have already played around with the low and upper limit of the z-axis. I get all sorts of possible coombinations of the same error - contour lines correct & colours incorrect.

I haven't crashed it in any of those attempts so far. I have seen OMP related errors on other software applications and I think they are related to the number of processors that Mathcad may be employing for this (trying to execute commands in parallel). Other software have options to enable or disable this. If you can't disable it, try working on an older or super new machine.

25-Diamond I
November 14, 2013

If you can't disable it, try working on an older or super new machine.

It was a slow single core machine running under Win XP (so it was 32bit version of course). Don't think I will find an older one around 😉

EDIT: YOur question reminded me on something but i couldn't remember what. Now I think I found it. The question as of seemingly wrong color mapping in Primes contour plots came up here before. At that time I guessed that the reason was that there were too few datapoints. Using some sort of interpolation helped but didn't cure it completely, I guess.

The thread is here: http://communities.ptc.com/message/203098#203098

15-Moonstone
November 18, 2013

The one question asked, but to get ignorred was labeling x-y axis. Currently, it is not possible. This request has been maded multiple times, but no action from PTC. Seems they do not think it is important.

25-Diamond I
November 18, 2013

The one question asked, but to get ignorred was labeling x-y axis.

The question wasn't ignored but was answered in the very first reply.

15-Moonstone
November 19, 2013

I am hoping that PTC may finally get the message. They do not seem to be listening.

24-Ruby IV
November 19, 2013

Sometimes when I prepare a picture from Mathcad for an article or a book I manual correct a counter plot in Paint for example.

25-Diamond I
November 19, 2013

Valery Ochkov wrote:

Sometimes when I prepare a picture from Mathcad for an article or a book I manual correct a counter plot in Paint for example.

Good idea but it shouldn't be necessary.

Unfortuneately quality plot never were a strength of Mathcad, not even in Mathcad 15 and below and to obtain publication quality plots you woul either have to export the Mathcad plots and finish them in another program, as you suggest, or export the data and redo the whole plot with another tool (Origin, or even Excel will do better sometimes).

Werner_E25-Diamond IAnswer
25-Diamond I
November 19, 2013

As the way you constructed the matrices X and Y crashes Mathcad on some installations (see above: http://communities.ptc.com/message/226620#226620) I created X and Y in a different way an now no problems are experienced. Of course the colours Mathcad shows still are wrong.

I added a simple 2D linear interpolation of your data and now Mathcad is showing the colors as we had excpected (despite the fact the the colors chosen are somewhat unskilled, especially the different shades of cyan). Nevertheless the Excel result still is prettier 😉

I would have thought that Mathcad would do that kind of interpolation itselft if told to plot the contours of a matrix rather than a function.

The attached file is in Prime2 format.

ContourPlot10kn_2.png

1-Visitor
November 21, 2013

That is odd. I created a 3-column matrix of the points, put it on the contour plot, and got a pretty good plot without having to interpolate. Not sure why the original method didn't work.

25-Diamond I
November 21, 2013

Nice approach and good to see that it works that way.

Nevertheless it should work the way it was originally setup with the three matrices as well. As it worked that way in MC15 I would call it a newly introduced bug which should be adressed in the next release.

The same is true of course for the severe bug where Prime crashes on 32bit system by using a simple operation with not that big vectors (http://communities.ptc.com/message/226620#226620)

Hope someone will be willing to report these two bugs to R&D.