1-Visitor
February 23, 2015
Solved

Getting the maximum value of a function?

  • February 23, 2015
  • 1 reply
  • 21263 views

Hi!

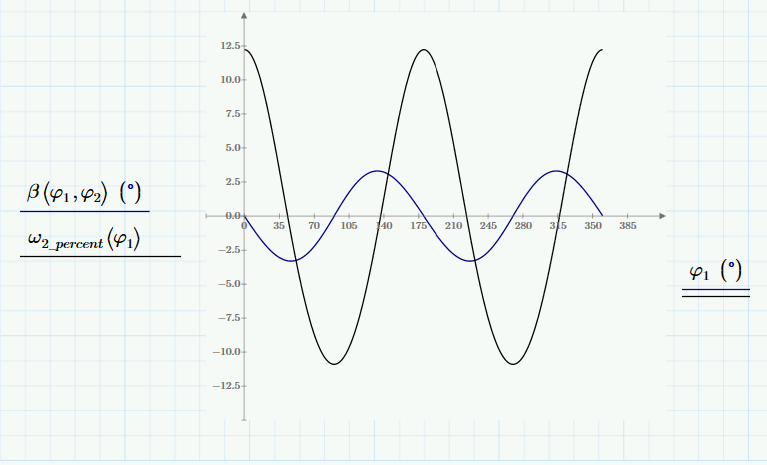
I am plotting the angular difference between the input and output shaft (beta) of a universal joint at an angle (alpha).
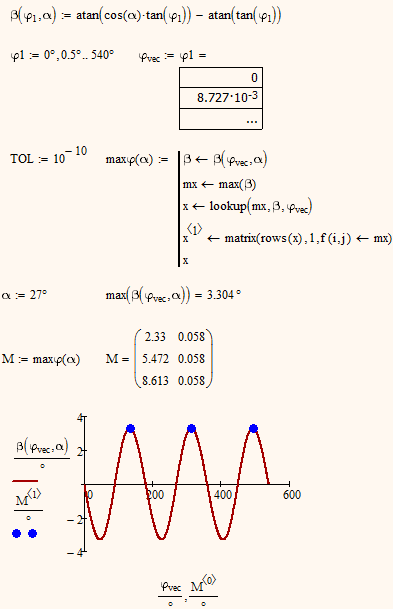
How can I get the maximum value of the function beta? (where beta is a function of phi1 and phi2, and phi2 a function of phi1)

I am using Mathcad prime 3.0.

Best regards
Christer Vestermark

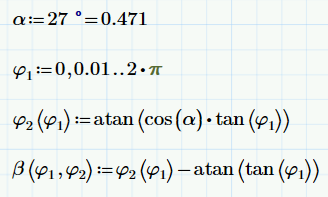
The relevant equations:

formulas.png

The plot, where the relevant function beta is purple.

plot.png

Best answer by Werner_E

Christer Vestermark wrote:

Thank you for the answer, but maybe I should have been more specific in my question.

I have just started using mathcad, and am aware of that this particular problem can be easily solved in different other ways.

What I really wonder is if it is possible directly obtain min/max values for an interval of a function that can be plotted.

Best regards

Christer

How to do it with function was shown by Dmitri. You need a guess and you get just one value.

Another option would be to turn beta into a vector and use the built-in max() function.

Maybe the attached picture helps. I am using a dirty undocumented trick to turn a range (phi) into a vector (phi.vec)

1 reply

1-Visitor
February 24, 2015

Hi, Christer,

in your case you can use beta as a function of single var phi1 instead of two vars.

Note that result depends on the guess value of phi1 (try 1 instead of 5).

optimize.png

1-Visitor
February 24, 2015

Thank you for the answer, but maybe I should have been more specific in my question.

I have just started using mathcad, and am aware of that this particular problem can be easily solved in different other ways.

What I really wonder is if it is possible directly obtain min/max values for an interval of a function that can be plotted.

Best regards

Christer

Werner_E25-Diamond IAnswer
25-Diamond I
February 24, 2015

Christer Vestermark wrote:

Thank you for the answer, but maybe I should have been more specific in my question.

I have just started using mathcad, and am aware of that this particular problem can be easily solved in different other ways.

What I really wonder is if it is possible directly obtain min/max values for an interval of a function that can be plotted.

Best regards

Christer

How to do it with function was shown by Dmitri. You need a guess and you get just one value.

Another option would be to turn beta into a vector and use the built-in max() function.

Maybe the attached picture helps. I am using a dirty undocumented trick to turn a range (phi) into a vector (phi.vec)