Solved
Is there a way to plot a function of (x,y) like ezplot in Matlab?
Hi, guys
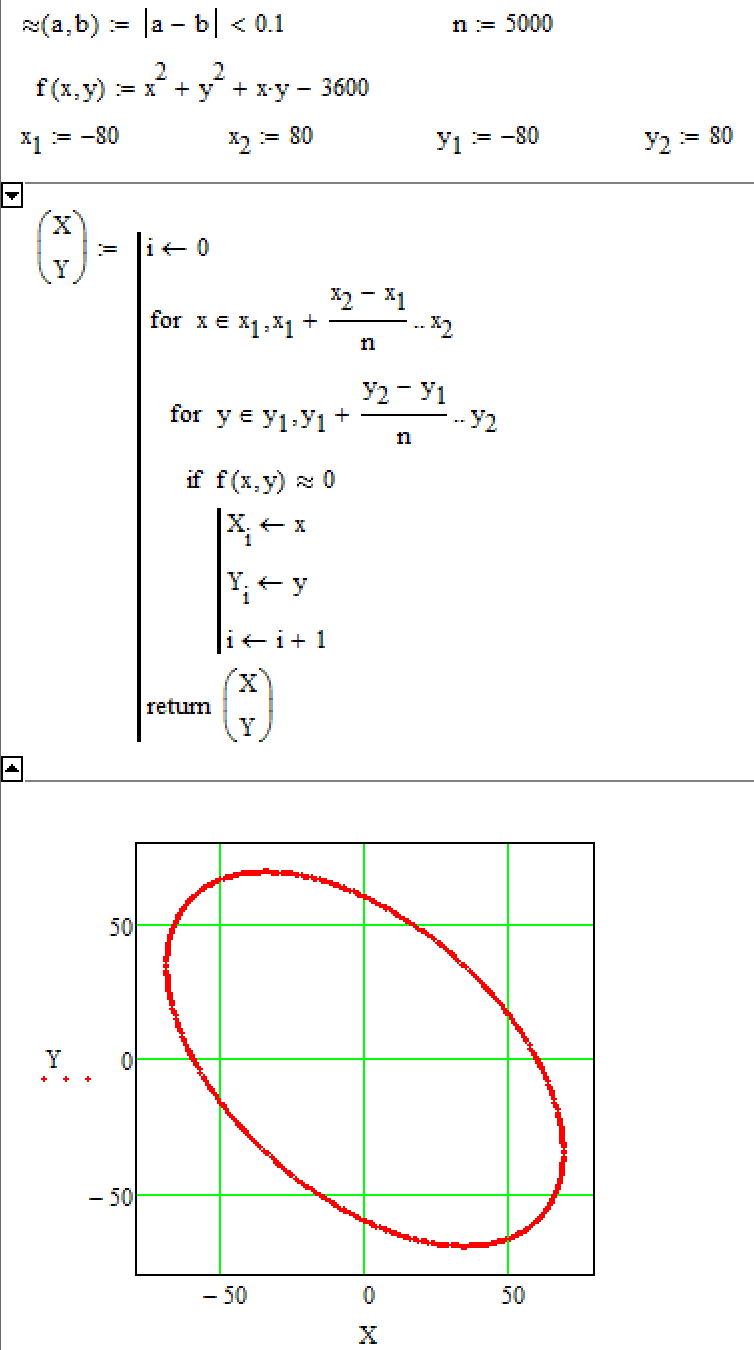
I want to plot the function:
f(x,y) = x^2 + y^2 +x*y - 3600, bounded with f(x,y) <=0;
Just like the graph shown below:
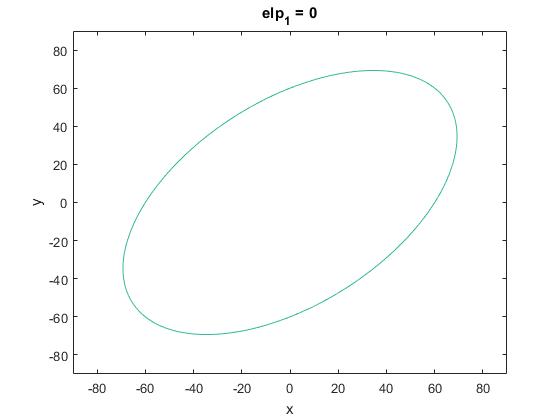
The figure is plotted with ezplot in Matlab.
function a=elp1(x,y)
a=x.^2+y.^2-60^2-x.*y;
end
figure(1)
h1=ezplot('elp1',[-90,90,-90,90]);
So far I haven't figured out an alternative in Mathcad that can do this.
Could you help me with some ideas?
Thank you very much!
Best
Shawn