1-Visitor
October 15, 2014
Solved

Mathcad Prime 3.0 X-Y Plot "Plotting Failed"

  • October 15, 2014
  • 2 replies
  • 4476 views

Hi,

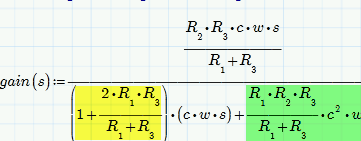
I am working on this worksheet, and I cannot get Mathcad to plot my equation. I get the following error: "Plotting Failed. Replace complex values and NaNs by real numbers."

I am not using any complex values and I shouldn't have any NaNs unless their is a syntax issue.

I have looked through many resources, and I haven't found a solution to this seemingly simple problem.

Thanks in advance,

Charlie

Best answer by Werner_E

As Mike already pointed out you have some unit problems in your gain function.

Have you ever evaluated gain() for a sibgle value of s? Sure not, so try it now.

The first unit mismatch is highlighted in the picture below. The fraction yield Ohm but the summand 1 is unitless.

Next problem may be that the green summand yields 1/sec^2 and so should the first summand.

1.png

2 replies

1-Visitor
October 15, 2014

I think the problem is with your gains function.

Break it down and change the unit compatibility.

Werner_E25-Diamond IAnswer
25-Diamond I
October 15, 2014

As Mike already pointed out you have some unit problems in your gain function.

Have you ever evaluated gain() for a sibgle value of s? Sure not, so try it now.

The first unit mismatch is highlighted in the picture below. The fraction yield Ohm but the summand 1 is unitless.

Next problem may be that the green summand yields 1/sec^2 and so should the first summand.

1.png