1-Visitor
June 2, 2017
Solved

Question of returning the correct bandwidth information of a bode plot

  • June 2, 2017
  • 4 replies
  • 4393 views

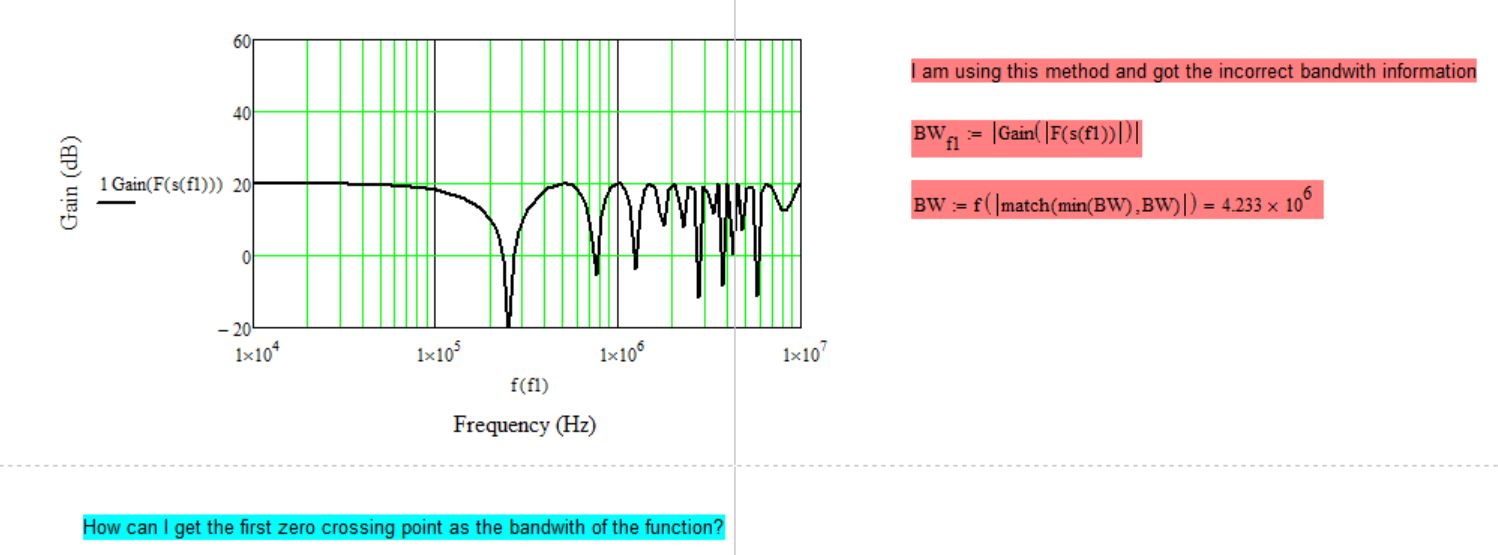
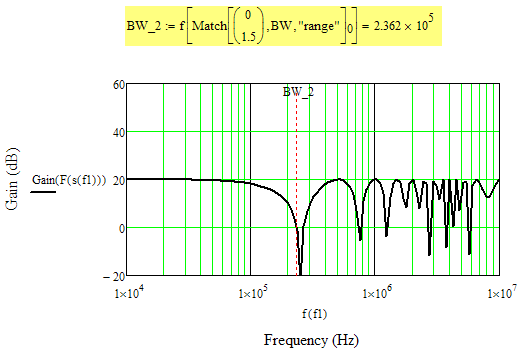
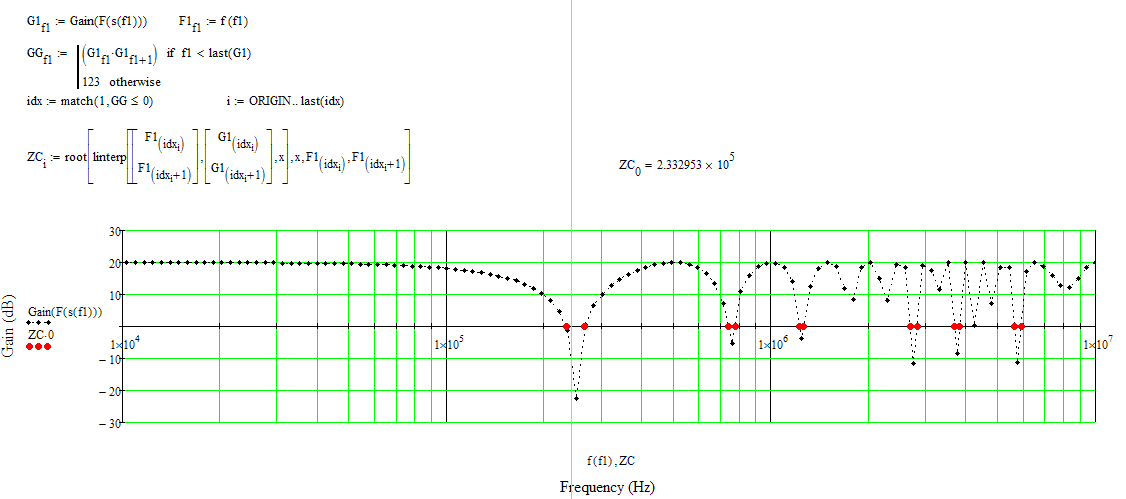
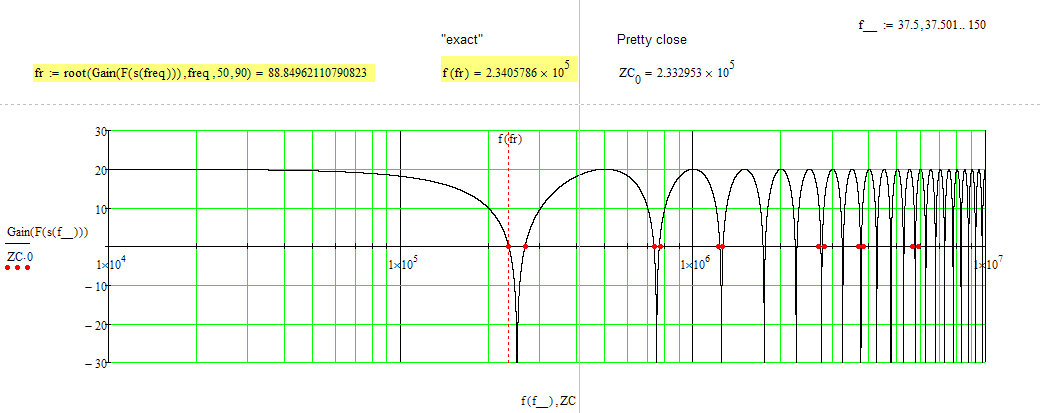
Hi all, I have a nonlinear function whose bode plot have multiple crossing of the 0dB line. I want to return the first zero crossing point from the bode plot as the bandwidth information, would anyone help me about this? The method I used to do only works for the function with only one zero crossing point. But it get some problems in this multiple-zero-crossing cases. Thank you!

BW_CALCULATION.JPG

Best answer by Werner_E

Your method fails as normally no value in your data set would be exact zero and match takes the one closest to zero (within a tolerance) and you would have really luck if this should be near the forst zero crossing.

So one one could be to use Match (note the capital M) from the Data Analysis Extrension pack to look for values near zero, (I have chosen the interval from 0 to 1.5) and take the first one found. Of course you would need to know how much off zero the first position is approx.

Another approach which gives you all zero crossings is here

and of course you can't really get ALL zero crossings if tha data set is too coarse:

P.S.: I also assume that you just have a set of data points and no function to play with.

4 replies

23-Emerald I
June 2, 2017

Try this:

yhuang-31-VisitorAuthor
1-Visitor
June 2, 2017

Thank you Fred, this method works when I have high enough points. In my real function (not the simplified function in this thread), the number was 150 (the same as this thread) and I was not able to get the correct results by using your method. When I increased the number to 500, I can get the correct results.

Would you briefly explain your method? Thank you!

23-Emerald I
June 2, 2017

The vector bw is the gain calculation without the absolute value.  The vector dx is the corresponding values to the elements in bw,

The function augment puts the two together side by side in a two column array.  The command csort arranges this array in ascending order of the "bw" column (column index 1).  Your bandwidth limit is then the frequency of the index corresponding to the lowest gain.

Werner_E25-Diamond IAnswer
25-Diamond I
June 3, 2017

Your method fails as normally no value in your data set would be exact zero and match takes the one closest to zero (within a tolerance) and you would have really luck if this should be near the forst zero crossing.

So one one could be to use Match (note the capital M) from the Data Analysis Extrension pack to look for values near zero, (I have chosen the interval from 0 to 1.5) and take the first one found. Of course you would need to know how much off zero the first position is approx.

Another approach which gives you all zero crossings is here

and of course you can't really get ALL zero crossings if tha data set is too coarse:

P.S.: I also assume that you just have a set of data points and no function to play with.

21-Topaz II
June 3, 2017

Bode plots example 0.jpg

23-Emerald IV
June 7, 2017

With reference to Re: Optimization of bandwidth and phase margin of a transfer function.

Set :

Then the (-3 dB) bandwidth is

and the unity-gain frequency is:

that is, just a little over 234 kHz.

Luc

23-Emerald IV
June 7, 2017

Oh, and the gain characteristic is:

You don't want to see the phase characteristic.

Success!
Luc