1-Visitor
June 10, 2013
Question

RLC Circuit Analysis

  • June 10, 2013
  • 2 replies
  • 39107 views

By Thomas Devaraj

RLC.png

About this worksheet:

  • Calculates the impedances across frequencies in a RLC passive crossover network 
  • Applicable in electrical engineering, electronics and high-tech industries, speaker design 
  • Performs using Excel, frequency, resistance, capacitance, inductance, angular frequency, reactance, impedance, etc.

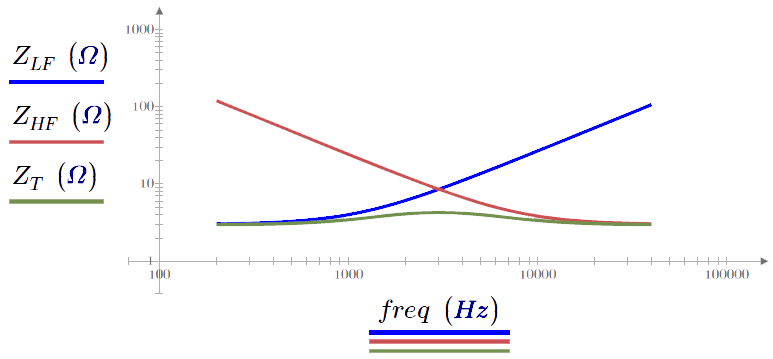
This worksheet using PTC Mathcad includes an example of an engineer designing a hi-fi speaker that must meet a certain frequency response. The horizontal trend must be over the whole spectrum of the audible range with a tolerance of +/- 1dB. Because at least two transducers are needed, you must look at the case in which there is both a low and high frequency driver. You can calculate the impedances of each to determine the overall frequency response.  This worksheet uses data from excel and plots the solutions.

Download and explore this worksheet yourself! You can download a free lifetime copy of PTC Mathcad Express and get 30 days of full functionality.

2 replies

1-Visitor
June 29, 2020

Hi


I am very new to Matchcad so these questions are very basic:

1. ORIGIN := 1 - What is it for?

2. Why there is an arrow above the absolute values of ZLF, ZHF and ZT?

3. Is "j" a reserve parameter in Matchcad for SQRT(-1)?


Thanks

Dat N

23-Emerald IV
June 29, 2020

Welcome

ORIGIN defines the starting index of vector and matrix elements. By default it is set to 0.

The arrow is to vectorize an expression.  Look that up in the help.. without vectorization,  using the |x| operator would give the length of the vector, producing a single number. With vectorization the result of that same operator is a vector with the absolute values of each of the elements.

The value i is the imaginary unit, such that i squared results in -1. You can use j for the same.


Success! 

Luc

1-Visitor
July 21, 2020

Hi Luc,


With your helps, I was able to plot the RC circuit in frequency domain. The problem is I would like to have the minor and major X-axis in log scale. How do you do that? 


I searched in this Forum and found a solution Grids_for_Prime.mcdx, unfortunately it is a mess and I do not have a clue what is going on. Is there a better solution to plot log scale on the X-axis? Y axis is linear so I do not have problems with it. 

Also from Grids_for_Prime.mcdx:

why we have this: G <--- [Nan Nan]

if axis = "y" and the following 2 lines (augment), can you explain what that means?


Thanks

Dat N


14-Alexandrite
August 23, 2020

Marin,


I know you have an RLC file on the PTC.

I have a circuit problem I have gone over for a week. Could not get the answer.

I forced the process to make the answer work but that is make fit and I know its wrong.

I started on it with the differential equation mesh (loop equation) method.

I did not get matching answers. Then moved to the simpler initial condition method this was where I got closer. Case the answer maybe wrong, not likely. 


Basically its the time constants here in the circuit there are two.

If you go by the usual RC  and RL time constants usually the simple case is either one or the other is used, here its both. Circuit reduction helps but this circuit's situation is the current in each branch.


If you got can do it easily or are interested to solve it.

I like to see the solution.


Regards,

Karl.

ttokoro
21-Topaz I
21-Topaz I
August 23, 2020

image.pngimage.pngimage.pngimage.png

t.t.
14-Alexandrite
August 23, 2020

Good.


Was that on solving a differential equation?

Do you have the steps you could send me?