1-Visitor
June 7, 2013
Solved

Residual plot in Mathcad

  • June 7, 2013
  • 2 replies
  • 4063 views

Hi.

I have this plot in MATLAB:

Untitled.png

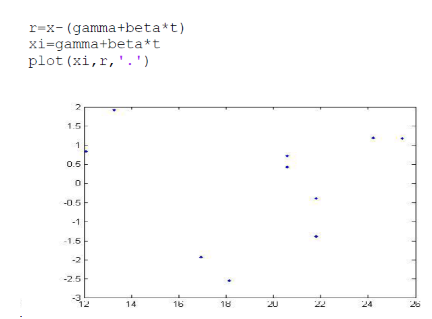
And i have triede to plot the same function in Mathcad:

Untitled.png

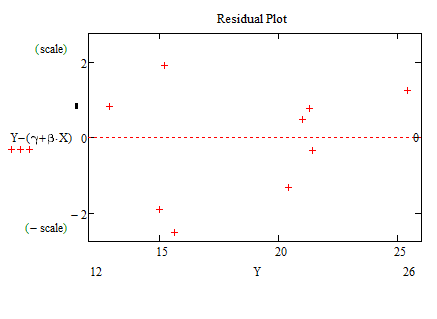
The points doesn't match. I think the problem is the xi value in the MATLAB code. How do i make exactly the same plot in Mathcad ?.

(x in Matlab is Y in Mathcad) and (t in MATLAB is X in Mathcad)

Best answer by AndyWesterman

something like this?

2 replies

24-Ruby III
June 7, 2013

Hi Osman,

How are defined variables "x", "t", "gamma", "beta" in your MATLAB document?

25-Diamond I
June 7, 2013

Maybe more luck if you attach your Mathcad worksheet here and provide the informations VladimirN has asked for. A pdf-document showing the Matlab code could be an option.

1-Visitor
June 7, 2013

The MATLAB code:

Untitled.png

My Mathcad document is also uploadet.

Thanks in advance

12-Amethyst
June 7, 2013

something like this?