1-Visitor
February 11, 2014
Solved

Horizontal axis in terms of pi

  • February 11, 2014
  • 2 replies
  • 6660 views

Hello all..

When creating a 2D plot, is there a way to have the plot show the horizontal axis ticks in terms of pi rather than real numbers?

plot.jpg

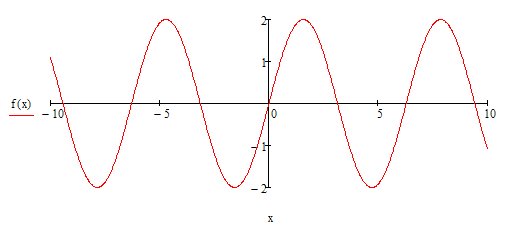
Here's a simple plot of f(x) = 2sin(4x)

The horizontal axis shows -10, -5, 0, 5, 10

I would like to add more ticks to this, but more importantly I would like them to be in tems of pi.

I looked through some of the previous posts, and MC 15 help, but I haven't found anything pertinent.

Any ideas?

Thanks

Best answer by Werner_E

When creating a 2D plot, is there a way to have the plot show the horizontal axis ticks in terms of pi rather than real numbers?

Unfortunately - no. Thats another rather old, long standing but unheard user request.

2 replies

15-Moonstone
February 11, 2014

Select end point of the x-axis as multipes of pi

fizzy1-VisitorAuthor
1-Visitor
February 11, 2014

Thanks for the file and the quick response, but the x-axis on your plot consists of real numbers, not in terms of pi.

Werner_E25-Diamond IAnswer
25-Diamond I
February 11, 2014

When creating a 2D plot, is there a way to have the plot show the horizontal axis ticks in terms of pi rather than real numbers?

Unfortunately - no. Thats another rather old, long standing but unheard user request.

fizzy1-VisitorAuthor
1-Visitor
February 11, 2014

Werner....

Seriously?!

25-Diamond I
February 11, 2014

Thomas Hartman wrote:

Werner....

Seriously?!

As long as you want integer or inter fraction multiples of pi displayed - yes. If you are happy with decimals representing multiples of pi you may try what David suggested.

The best I can come up with is this (and the x-axis labelling is abit confusiong because of the missing pi)

11.02.png

11.02b.png