How do you change the color? |
Menu Format/Equation, then choose the style you want to change (I used "User1" and changed it name to "Variables_violet"), click "modify".
To change the style of an elelemnt in a region, select it and then either use format/Equation as above or choose the style from the drop down list left to the font selector in the menu line.
These styles can be convenient, e.g. many people have created a style "complex" which is the same as "Variables" but underlined. Applying styles can be a bit cumbersome, one would wish it could be done using ricght click menu.
OK. I understand. But, why inverse? |
original function f: x --> y (f(x) = y)
inverse function f^-1: y --> x
In your case:
X1: (alpha, x0) --> x
alpha: (x,x0) --> alpha
so alpha is the inverse of X1 for constant x0
Is it possible to construct a polynomial to fit the whole curve (particularly the section that quickly drops down)? |
Did you play with my Version09-sheet with the degree of the polynomial fit? Number of points for x seems to have nearly no effect.
Maybe you could achieve better results with a 2-dimensional approximation for a specific constant value of x0. We have done that type of fit in recent postings of yours.
Or you may split the function in parts and doing a polyfit foreach part separetly.
I have played around with the polynomial fit and came up with versions which generate more datapoints with smaller values of x. As I suspected in an earlier post a polynomial fit doesn't seem to be appropriate for that type of function, especially it can't cope with the rapid drop at the beginning (small x values).
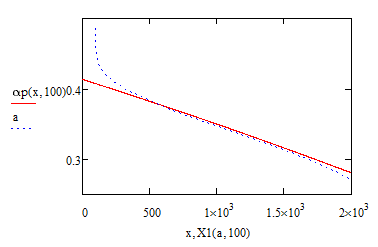
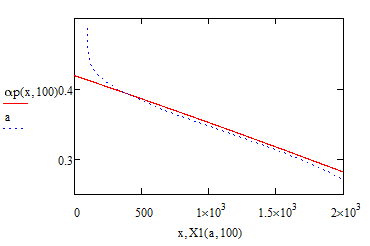
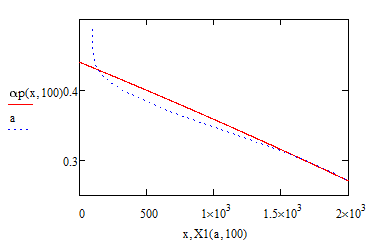
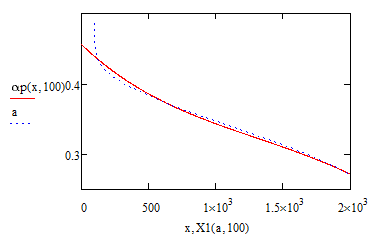
Find below screenshots of the four versions, all are from polynomial surfaces of fifth order and for each value of x0 there are 200 (better said 201) datatpoints for x generated. Screenshots were taken for x0=100.
Version 09 (posted earlier): datapoints for x are evenly distributed over the whole range
Version 10: range is split in two. 50% of all point are generated within the first 2% of the whole range. Datapoints for x are evenly distributed in each range
Version 11: The Datapoints for x are logarithmically distributed over the whole range in the hope to put more weight on the samller x

Version 12: range is split in two. 50% of all point are generated within the first 2% of the whole range. Datapoints for x are logarithmically distributed in each range
And here is a Version12 fit of order 15:
So you see that all those efforts were nearly in vain.
So you may play around with the various versions, change the order, number of points or the percentages in V10 and V12, but I doubt you will find a good fit.

