How to draw a full sphere
- January 22, 2016
- 1 reply
- 7490 views
Hi,
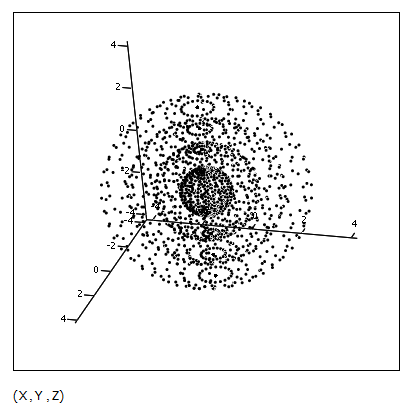
I have drawn a sphere (you can find the attached file), but the data points are on the surface. I want a full sphere. As an example I drew only @r=3 and @r=5
My first question is, I don't have an idea why we write λ(Θ,ϕ) <-- F(r,0,0,0,Θ,ϕ) on the 3D scatter plot. Why cannot we write F(r,0,0,0,Θ,ϕ) on the graph?
I tried to write a for loop for the radius (r=0, r=0.1 .... r=n) and i want to see all the spheres on the graph.
One more important point is that I need the x,y,z coordinates for these spheres but even for one single sphere I cannot see the coordinates of the data points.
So to sum up,
I have the code that draws a sphere but it only draws the data points on the surface, I need a full sphere. And, I need the coordinates of these data points. Could you please help me?