23-Emerald V
February 8, 2013
Solved

Mathcad Prime 2.0 2D matrix plots?

  • February 8, 2013
  • 2 replies
  • 4774 views

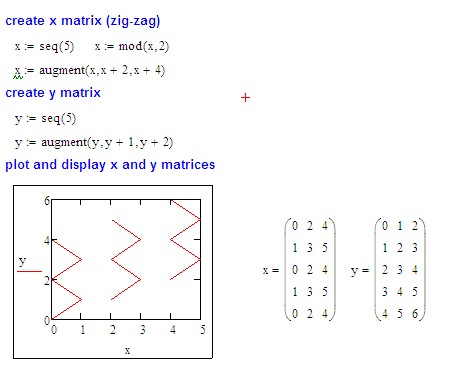
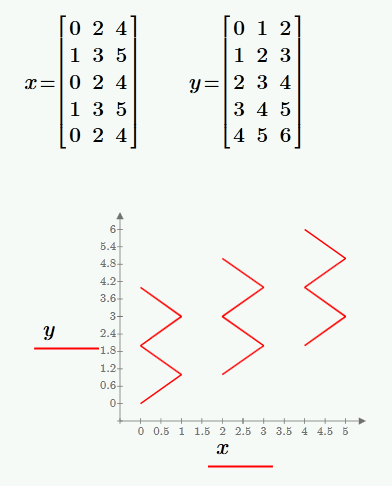
I've just had a quick look at Prof Birkeland's M15 Programming tutorial (http://communities.ptc.com/docs/DOC-3454) and, out of idle curiosity, wondered what a couple of the 2D plot exercises would look like in Prime Express. However, whereas Mathcad <=15 will cheefully plot all the columns of a matrix, Prime wouldn't; a brief glance at Prime's Help confirms that an XY Plot will only plot the first column, rather than it just being an Express limitation. Is there another way of doing this in Prime? Or is it planned for a later release?

Stuart

collab+-+13+02+08+M15+v+Prime+2+2D+plot+01.jpg

Best answer by Werner_E

Just read the Prime2 Migration Guide and there is no workaround necessary:

Click on graph, choose ribbon "plots", "Change Type", "Waterfall Trace"

PlotMat2.png

2 replies

25-Diamond I
February 8, 2013

Thats interesting, I wasn't aware of that limitation.

A workaround could be something like the following

plotMat.png

Werner_E25-Diamond IAnswer
25-Diamond I
February 8, 2013

Just read the Prime2 Migration Guide and there is no workaround necessary:

Click on graph, choose ribbon "plots", "Change Type", "Waterfall Trace"

PlotMat2.png

23-Emerald V
February 8, 2013

Thanks, Werner. Now that you've mentioned it, dim, shadowy memories are attempting to surface ...

Stuart