1-Visitor
March 15, 2015
Question

X-Y Trace precision

  • March 15, 2015
  • 2 replies
  • 3138 views

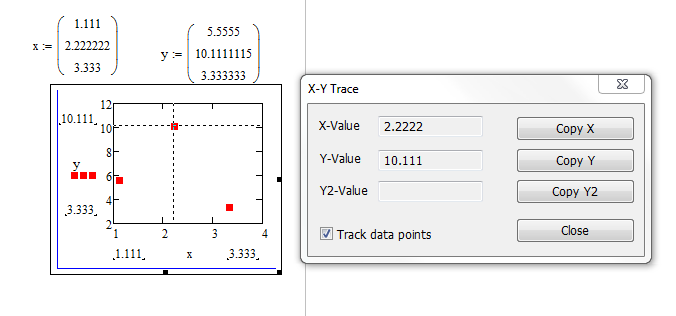
I have a question about the x-y trace function in MC15

When you select a point, the trace box only displays the co-ords to 5 sig figs - if you "Copy x" or "copy Y" you don't get any more precision, and it is not enough to uniquely identify a point when you have a Monte Carlo analysis with 10^6 points. Is there any way I can increase the resolution? The little example below illustrates my point

2 replies

19-Tanzanite
March 15, 2015

Unfortunately, 5 significant figures is what you get.

19-Tanzanite
March 16, 2015

You could try something like subtracting the displayed trace values from everything and plotting the result. The new trace should show the next 5 significant figures.:

precision.PNG

Alan.

Ian11-VisitorAuthor
1-Visitor
March 16, 2015

Ok - lets put the question around a different way. I have a plot with 10^6 points on it, example below. The array used to plot it contains more columns. I want to be able to pick a point and find it in the array and then view other columns. I tried using the "match" function but because TRACE doesn't give me enough sig figs it fails to locate the values.

Any ideas how to select a point on the plot and find it in an array

19-Tanzanite
March 16, 2015

You could start by homing in on the region of interest. Alter the start and end of the range on each axis (do this directly on the graph). Repeat until you are just viewing a few points. Apply the process I noted above to the data in the columns that are plotted. Then use "match".

Do you have to do the point selection by hand? What criteria is the selected point based on?

Alan.