

Question
Time series graph binding
Hi,
We have have data as below table
| Plant | Weight in tons | Time |
| P1 | 500 | 6/9/2017 |
| P2 | 600 | 6/10/2017 |
| P3 | 700 | 6/11/2017 |
| P4 | 800 | 6/12/2017 |
| P1 | 900 | 6/9/2017 |
| P2 | 1000 | 6/10/2017 |
We what to bind the above data to graph as below, X-access time is fine when it comes to Y-access we are getting data for all in single column but we want to show different lines based on Plant type (P1,P2,P3 etc).
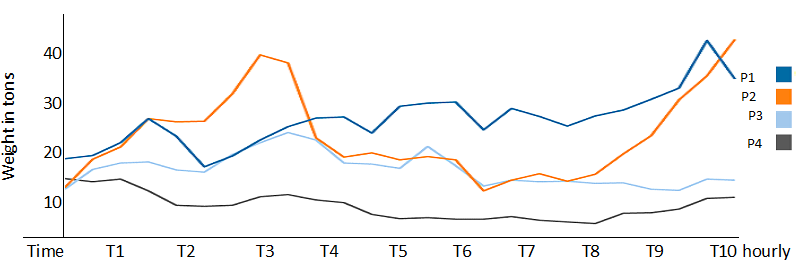
How can we achieve this please help us?
Regards,
Anil Kesana