

Question
Widgets that provide a Gantt-style display?
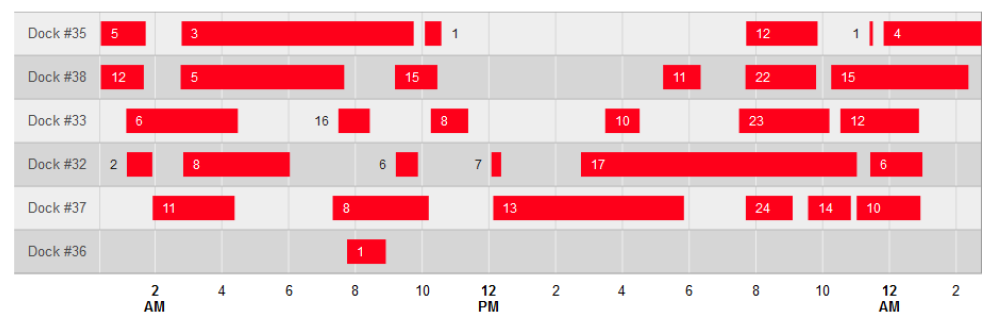
Are there any existing widgets that would let me generate a gantt chart along the lines shown below? The example below depicts 6 truck loading docks at a distribution center - the red bars reflect times when the loading dock was in-use during the course of the day (and numbers on the red bars the number of forklift load events).
Alternately, are there any extensions that provide a widget that could do this?
Absent such a widget (or my having the ability to create a custom widget of this complexity), does anyone have suggestions on creative ways to use existing widgets to convey this information to users, albeit in a different style? TIA.