13-Aquamarine
November 14, 2011
Question

Mechanica results variability

  • November 14, 2011
  • 4 replies
  • 9756 views

I've just run a Mechanica sensitivity study (linear static, using Single Pass Adaptive, remesh and repeat P-loop each iteration) and got the following result:

pro-m_odd_point.png

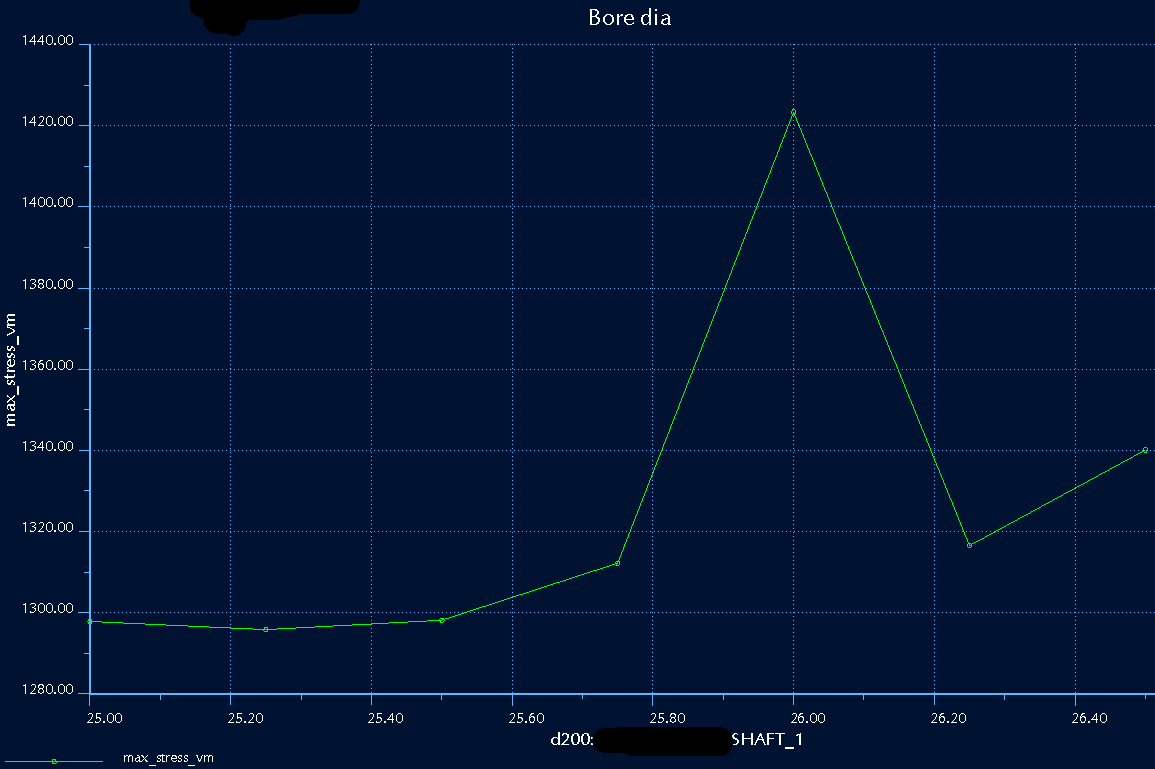
(If this isn't legible, the lower end of the curve shows just under 1300 MPa at a dimension value of 25, increasing to 1340 at 26.5 but with a spike of 1420 at 26.0.)

I've used mesh controls to apply a pretty fine mesh, and geometrically there's no reason for any odd results at that particular point (I'm varying the bore of a shaft with OD 42, and max stress is on a chamfered radial Ø3 hole through this portion of the shaft).

More strangely, I then set the dimension to 26 and ran a single static analysis - and found a max_stress_vm of 1321 MPa, which fits the curve pretty much perfectly and disagrees with that high data point.

This spike is a variation of 7-9% on the 'basic' stress which seems like a very large error margin - what gives? I've tried Multi Pass Adaptive in the past, but I've found that without mesh controls it doesn't necessarily converge well, so I generally just use SPA and use my judgement to add mesh controls where needed. As you can see, six of my seven data points do follow a smooth curve using this technique.


This thread is inactive and closed by the PTC Community Management Team. If you would like to provide a reply and re-open this thread, please notify the moderator and reference the thread. You may also use "Start a topic" button to ask a new question. Please be sure to include what version of the PTC product you are using so another community member knowledgeable about your version may be able to assist.

4 replies

1-Visitor
November 18, 2011

Hi Jonathan:

Please contact PTC technical support and file an issue so that we can take a look at this problem.

Thanks

Eduardo

13-Aquamarine
November 18, 2011

Hi Eduardo,

Unfortunately I did not save that particular analysis.

The part has changed since then, and I do not have a record of the exact combination of parameters which gave this result.

I will bear this in mind for future analyses.

Thanks,

Jonathan

13-Aquamarine
April 26, 2012

Okay, it's done it again.

I've zipped up the result sets (thereby including the models) and have opened Case 10789069.

1-Visitor
August 24, 2012

In your first example, did you try to make a sensitivity study from 25.75 to 26.25 with 3 steps in order to see if the same problem occurs at 26?

13-Aquamarine
August 24, 2012

Thanks Sylvain - that's a good suggestion.

I've just run a test, and the sensitivity does return a consistent result for a given dimension value - so yes, the value at 26 would be the same regardless of the step size.

My colleague has come up with a theory as follows:

We know that for a sensitivity study, a 'clean' session of Pro/E is launched to regenerate the model each time. You can see this, because it places trail.txt.1, .2, .3... into the working directory for the analysis - therefore it does not read the normal config.pro.

Perhaps this 'clean' session regenerates the model to mid-limit dimensions, whereas our normal config.pro regenerates at the nominal value. In this case, the geometry would not be exactly the same as that produced by a 'normal' session of Pro/E, and so the mesh could be different which would ultimately cause the stresses to be different.

PTC have finally acknowledged the problem and filed SPR 2146259. They also report that running MPA in the sensitivity study gives the same result as the SPA single-analysis - I'm not sure whether this is really relevant...

1-Visitor
August 24, 2012

Let's investigate a little bit further:

In the first message, you said "More strangely, I then set the dimension to 26 and ran a single static analysis - and found a max_stress_vm of 1321 MPa, which fits the curve pretty much perfectly and disagrees with that high data point."

Could you try a single static analysis with the dimension sets to 25.75 in order to check the accuracy of this step of the sensitivity analysis?

Your colleague's theory could be true, but it doesn't explain the peak in the result's curve.

13-Aquamarine
July 30, 2015

A possibly related issue: I've been running a lot of sensitivity studies recently, and I'm finding that the mesher within the study is less reliable than the mesher when accessed from the GUI.  I've had a study trying to mesh the last step for over an hour now; I adjusted the model to the same values and ran the direct mesher, and it completed in 5.08 minutes.

Something's clearly different within a sensitivity study to the 'normal' interface.

Incidentally I've been experimenting with running sensitivity studies manually, pasting the measures into Excel after each step.  This has several advantages:

  1. You can review each result step and decide whether to extend the study in one direction or the other; or to add more intermediate points;
  2. If one point fails, the whole analysis does not need to be re-run;
  3. You can generate the mesh for the next point while the previous point is still running, thus making better use of a multi-core CPU!
1-Visitor
August 5, 2015

One difference I can think of, is whether the measure uses the existing mesh (from a previous pass after variing the geometry) or not (which should be the case when you run from GUI for a fix geometry)
Gunter

13-Aquamarine
August 10, 2015

Thanks Gunter.  I pretty much always select "Remesh after update" (and even when I don't it usually seems to remesh anyway) so this shouldn't be a factor.

1-Visitor
August 7, 2015

I have seen results like this when I make sensitivity plots of global measures such as "max_stress_vm". In such cases, the maximum von Mises stress, might occur at one location in the model, for a certain parameter setting, but in an entirely different location in the model for a different parameter setting. The measure vs.parameter plot then may appear discontinuous. In such a case, if you create local "at point-" or "near point-" or "over selected geometry-" measures this problem goes away. But I obviously can't verify if this is the case for your model.

13-Aquamarine
August 10, 2015

Thanks Mats.

I do use "over selected geometry" measures most of the time these days.  However, this doesn't address the basic issue that running the same model gives different answers depending on whether it's standalone or within a study.

My most recent update about meshing is also weird - as I said before, it's just maths, and if you ask a computer to do the same maths (however complicated) twice, it should give you the same answer twice.  This applies just as much to the meshing as to the stress results!

1-Visitor
August 10, 2015

Oh, I didn't realise you got different results in design study vs regular analysis, I thought it was the discontinuity that was the issue. Need to read more carefully... Strange though, as you point out, it should give roughly the same result. A small discrepancy would be understandable if mesh settings are slightly different when running design studies vs standalone, but not a significant one.