1-Visitor
March 17, 2015
Solved

Defining variable greater than/equal or less than/equal

  • March 17, 2015
  • 1 reply
  • 6777 views

eisaatana.PNG

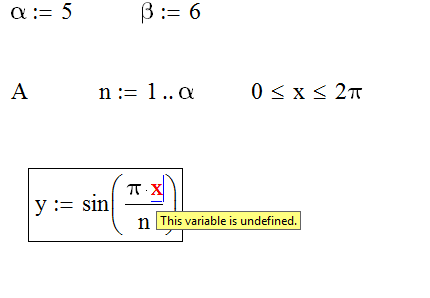
I was trying to draw this graph, but how im supposed to define x ?

Best answer by RichardJ

See the attached worksheet.

A Boolean inequality like that does not assign any values to x. The only way to make a numeric assignment is to use the numeric assignment operator (typed as ":", appears as ":=")

1 reply

19-Tanzanite
March 17, 2015

Do you want x to be the independent variable on the graph? If so, what are you trying to do with n? Do you want one curve on the graph for each value of n? Lastly, which version of Mathcad are you using?

rsuorsa1-VisitorAuthor
1-Visitor
March 17, 2015

6 different curves for each values of n. Im using trial version of Mathcad 15. If I understood the assignment correctly the value of x means that im supposed to draw the curves between 0 and 2pie.

RichardJ19-TanzaniteAnswer
19-Tanzanite
March 17, 2015

See the attached worksheet.

A Boolean inequality like that does not assign any values to x. The only way to make a numeric assignment is to use the numeric assignment operator (typed as ":", appears as ":=")