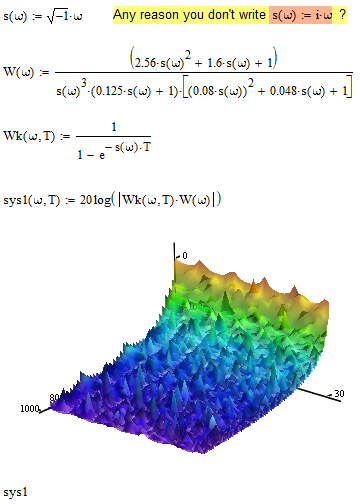
Martin, in case you are still with us and prefer a simpler variant, see attached. I tried to stay close to what you tried but you should keep in mind that you may have better control using methods like CreateMesh() as shown by Andy.
You can "plot a function name" and in fact in 3D-plots you must use the function name alone without any parameters to make the plot work. But to plot a surfcace in a 3D plot, you must use a function in two variables. So your function sys1() (and also Wk()) must be (and are) dependend on omega AND T.
If you fix this you can plot your surface exactly as you tried. You don't need any range variables (they won't help here anyway), but you must set the range for the two parameters in the plot format menu, tab QuickPlot data. Here you set start, end value and grid number similar to the parameters of createmesh(), but you are not allowed to use variables here, so createmesh() may have its merits. The default range for those parameters includes zero and that the reason you get an error (divide by zero) unless you change the plot range.
The look of your surface may change significantly if you change the grid size only slighty. This is due to the nature of your function. E.g. you have poles for every omega being an integer multiple of 2*pi/T and depending how close a grid point comes to this value you may see a more or less distinct peak. And playing around with the grid size and/or the range for omega and T is much easier with Createmesh() than doing it in the format menu. So I'd prefer the way Andy had shown.