> Could you please tell me, what type of brackets do I need to use ?.
You are experiencing problems with P1 because you did not realize that the elements of P1 are 1 x 1 matrices. You have to create them (at least one of them, then copy and edit) in some empty space on your worksheet and then copy and paste it from there.
This was the reason why I showed with P2 how to create the same structure using the "stack" command. The "stack" command is for stacking one matrix on top of another but it can also used with just one argument and if this argument is a scalar, "stack" will return it as 1 x 1 vector.
Basically when plotting points in a 3D-plot you have to provide a 3 x 1 vector and the three vector elements have to be n x 1 vectors consisting of the x, y and z coordinates of the points to be plotted. Thats how P34 works. plotting both points at once. Another way is to provide those three vectors (lets call them X, Y and Z) as (X,Y,Z) directly in the plot placeholder like you have done with (A,B,E). But I prefer to create one vector with all, assign it to a variable (like "curve3D" in my last file) and use that variable for plotting.
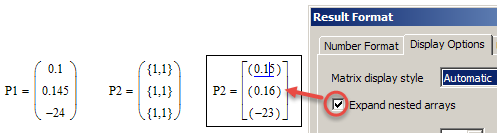
You can see the difference between P1 and P2 if you evaluate both variables:
In case you wonder: The three red points which correspond to P1 in your plot are ( 0 / 0 / A1 ), ( 1 / 0 / B1 ) and ( 2 / 0 / E1 ). The 0,1,2 are ORIGIN, ORIGIN+1, ORIGIN+2.
WE

