15-Moonstone
October 13, 2026
Solved

Is it possible to create equation curve that is a sine curve with a tighter upswing and looser downswing of the curve

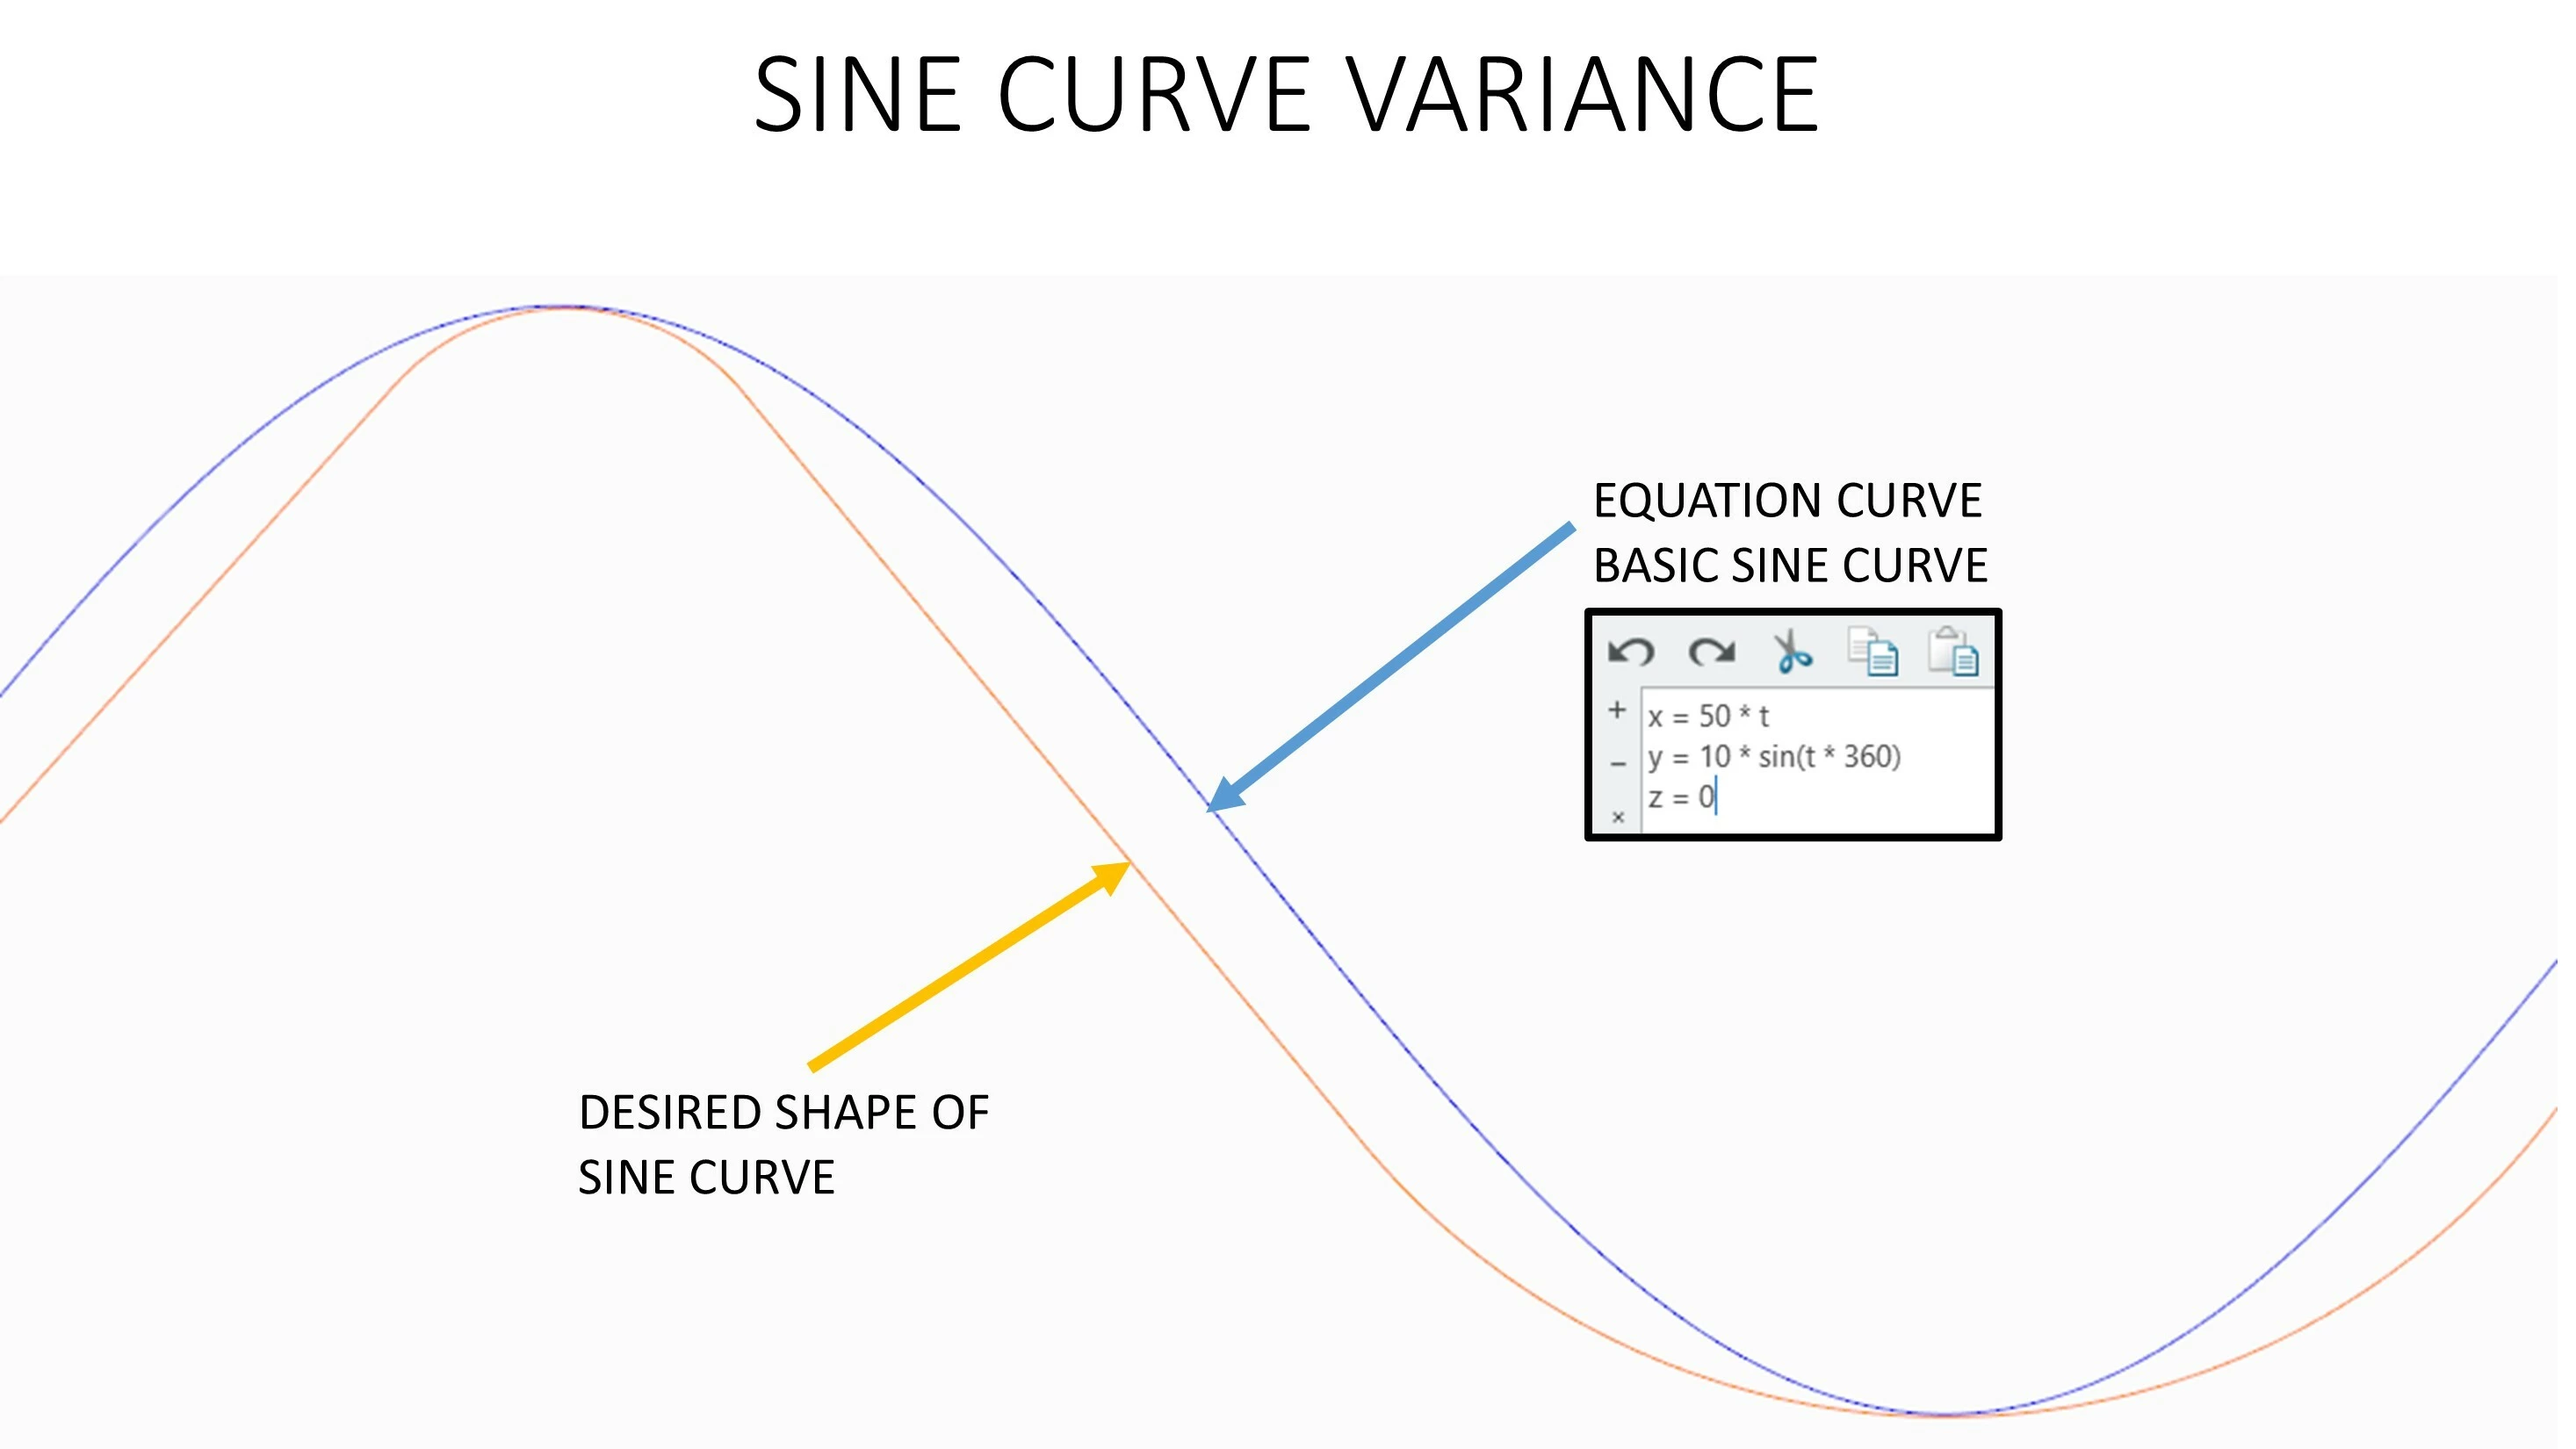
I have extensively used equation curves based on the sine curve formula in the work I do.  I would like to be able to vary this to where the upswing of each wave is tighter than the downswing.  The wave itself would retain the same height on the upswing and downswing only the radius values would change.

Below is a mock up of what I am hoping to be able to do.  Also, I would like to be able to repeat this pattern.  I am hoping that this would be possible.
 

    KenFarley
    KenFarleyAnswer
    21-Topaz II
    October 13, 2026

    You might be having trouble because of the nomenclature.

    The x and z components of the equations driving your curve will remain the same.

    The calculation of the y component in the adjusted sine wave will be what you apply the modulated curve to. Also, for equations defined in Creo, the angles provided to trigonometric functions are in degrees, so multiplying by “2 pi” is incorrect. The “0.3” term in the equation is in rad, but again Creo deals in degrees, so 0.3 should be about 17.18.

    The equations I put in to define an adjusted sine wave are:

    x = 50 * t
    y = 10 * sin ( 360 * t - 17.18 * cos ( 360 * t ) )
    z = 0

    You can adjust the “17.18” to change the shape of the curve to your liking.

    11 replies

    tbraxton
    22-Sapphire II
    October 13, 2026

    Assume that we are in the time domain. You have to develop an equation that varies the frequency as a function of time over a single period. Assume the period is 1 second (freq of 1 Hz). You can generate such a wave form from equation.

    The equation used to generate this waveform shown below is:

    x(t) = sin( 2πt − 0.3·cos(2πt) )
    Plot is a function of time from 0-1 second on X-axis with Amplitude on Y-axis

    Derived quantities for this plot:

    • Phase modulation index: β = m·f₀/f_m = −0.3 rad
    • Instantaneous frequency: f(t) = f₀(1 + m·cos(2πf_m t)) → swings 0.70 Hz at t = 0 to 1.30 Hz at t = 0.5 s
    • Window: t ∈ [0, 1] s — one period of f_m

    General form of the equation: 

    x(t) = A · sin( 2πf₀t + (m·f₀/f_m)·cos(2πf_m t) )
    Parameter Value Meaning
    A 1 Amplitude
    f₀ 1 Hz Carrier frequency
    f_m 1 Hz Modulating frequency
    m −0.3 Frequency-modulation depth
    Translate
    tbraxton
    22-Sapphire II
    October 13, 2026

    By introducing a phase shift the amplitude will be zero at t=0. Here is the function plot over 3 seconds with the phase shift introduced.

    x(t) = sin( 2πt − 0.3·cos(2πt) + 0.3 ),   t ∈ [0, 3] s


    Translate
    pimm15-MoonstoneAuthor
    15-Moonstone
    October 13, 2026

    Tbraxton:  Sorry but I’m not familiar with the interface you are showing.

    I did try plugging in the x(t) = sin( 2πt − 0.3·cos(2πt) ) formula in the Equation Curve Editor and this errored out.

    I also am a bit confused in regard to the charting of derived quantities.

    It does appear that you are getting the type of curvature I am looking to have.  If I was able to follow this and be able to project the results in a sketch it certainly should work.

    Translate
    KenFarley
    KenFarley21-Topaz IIAnswer
    21-Topaz II
    October 13, 2026

    You might be having trouble because of the nomenclature.

    The x and z components of the equations driving your curve will remain the same.

    The calculation of the y component in the adjusted sine wave will be what you apply the modulated curve to. Also, for equations defined in Creo, the angles provided to trigonometric functions are in degrees, so multiplying by “2 pi” is incorrect. The “0.3” term in the equation is in rad, but again Creo deals in degrees, so 0.3 should be about 17.18.

    The equations I put in to define an adjusted sine wave are:

    x = 50 * t
    y = 10 * sin ( 360 * t - 17.18 * cos ( 360 * t ) )
    z = 0

    You can adjust the “17.18” to change the shape of the curve to your liking.

    Translate
    pimm15-MoonstoneAuthor
    15-Moonstone
    October 13, 2026

    Ken:  This absolutely is what I was hoping for!  Yes, understanding how to convert from different units can be a hurdle.

    I appreciate your answer which I could verify and I appreciate everyone’s help in pointing in the right direction.

    Translate
    tbraxton
    22-Sapphire II
    October 13, 2026

    I did not generate these curves here shown in Creo because there are much better tools for exploring the math. I also made some assumptions based on your initial post about your extensive experience using equations from curves which is probably causing some confusion here. I just posted one method that can be used to generate an equation of the form you requested. The equation needs to be converted into the proper syntax for the equation editor in Creo to interpret it. If you just paste the provided equation into Creo it will not work as intended. You need to deal with the radian/degree units, domain definition etc. before entering it into Creo. When I get time, I will work on converting it to a form that works in Creo.


    Translate
    pimm15-MoonstoneAuthor
    15-Moonstone
    October 13, 2026

    Perhaps I should not have used the term extensive use of equation curves.  Yes; I do use this quite frequently but it’s within a limited scope with sine curves in the Equation Curve editor.  I do not have much of a feel for how different functions can alter the shape.  At this point I can only influence needed sizes.

    It would be appreciated if you could convert the equivalent formulas into use within the Creo Equation Editor but don’t go to a lot of trouble.  If this isn’t straight forward to acquire the needed shape perhaps the best idea might be through using an alternate method.

    Translate
    tbraxton
    22-Sapphire II
    October 13, 2026

    I would ask what are you using this equation driven curve for? The context may be important because if you explore the nature of the general form of the equation I initially presented it might matter. Note how the waveform will change based on parameter “m” noted above. This might mean it is not the best or even a good equation for your intended use.


    Comparison plot for values of “m” parameter
    m=0 is a pure sine wave


    Translate
    pimm15-MoonstoneAuthor
    15-Moonstone
    October 13, 2026

    Tbraxton:  In this case the form can be fairly loose.  The application for the scallops is for grip on tooling which has worked fairly well.  I am envisioning that a tighter pattern might even be better than what I presently am using.  Since the tooling is fairly large, I am hoping to not give our machine shop more work by decreasing what would be the fillets on the tooling.  To be able to have the corner and fillet values tied together and yet separate in size will be very helpful.  

    Translate
    tbraxton
    22-Sapphire II
    October 13, 2026

    If I am picturing this correctly, you are using it to “maximize” the radius at the trough of a cut taken out of material with a cutter. It will be something like this cut taken from the block? I am not sure what “controls” you want to use to drive the geometry in Creo, but it should not cause an issue with tool-path generation as it is a continuous function over a range of values that should be suitable. 


    Modulated sine wave cut topology to expand trough


    Translate
    pimm15-MoonstoneAuthor
    15-Moonstone
    October 13, 2026

    Yes; that would be very close to how the application looks that I would be using this for.  I have just projected the sine curve to a sketch and have extruded the sketch to apply to the tooling.  This certainly beats using a repeated pattern.

    Translate