

Validation case: Pressure Drop Along Pipe Length
I’m trying to run a validation case in Creo 12 Flow Analysis based on the first example in the link below, but I can’t seem to reproduce the same results shown in the example:
The pipe is designed with an inner radius of 2 mm and a length of 2000 mm.
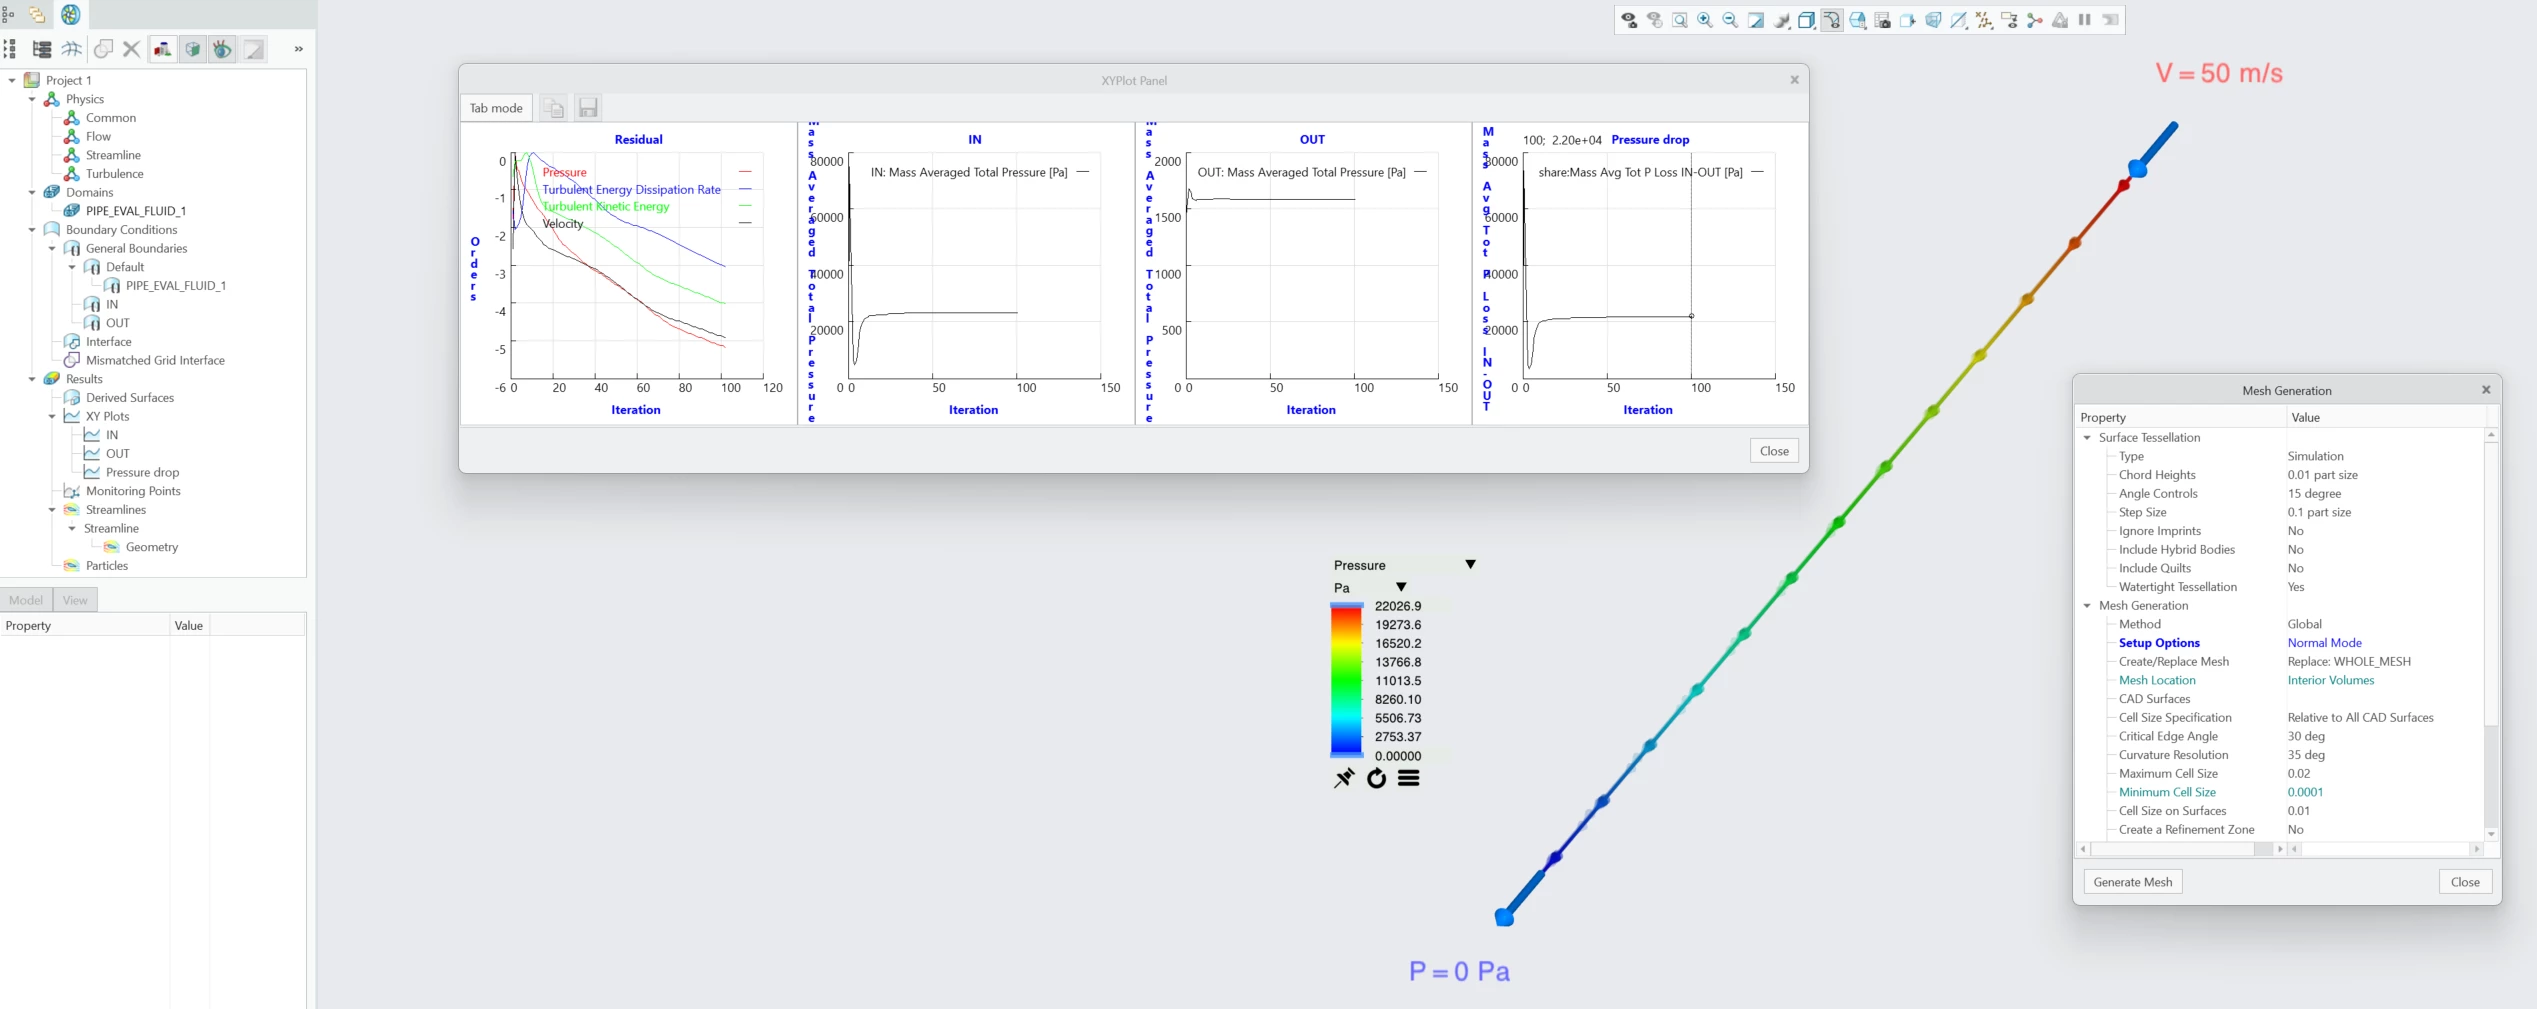
In Flow Analysis, I define the inlet (IN) with a velocity of V = 50 m/s, and the outlet (OUT) as a specified pressure outlet of 0 Pa.
The air density is set to 1.225 kg/m3 and the dynamic viscosity to 1.7894e-5 Pa·s.
To display the mass-averaged total pressure difference directly as a graph, I use the following expression:
plot.MassAvgTotP_Loss = flow.mpt@IN - flow.mpt@OUT
#plot.MassAvgTotP_Loss: Mass Avg Tot P Loss IN-OUT [Pa]
However, my results are significantly different from the values stated in the example. I get approximately 21,970 Pa difference between the inlet and outlet, while the example shows a pressure drop of 0.73 Pa.
What am I doing wrong?
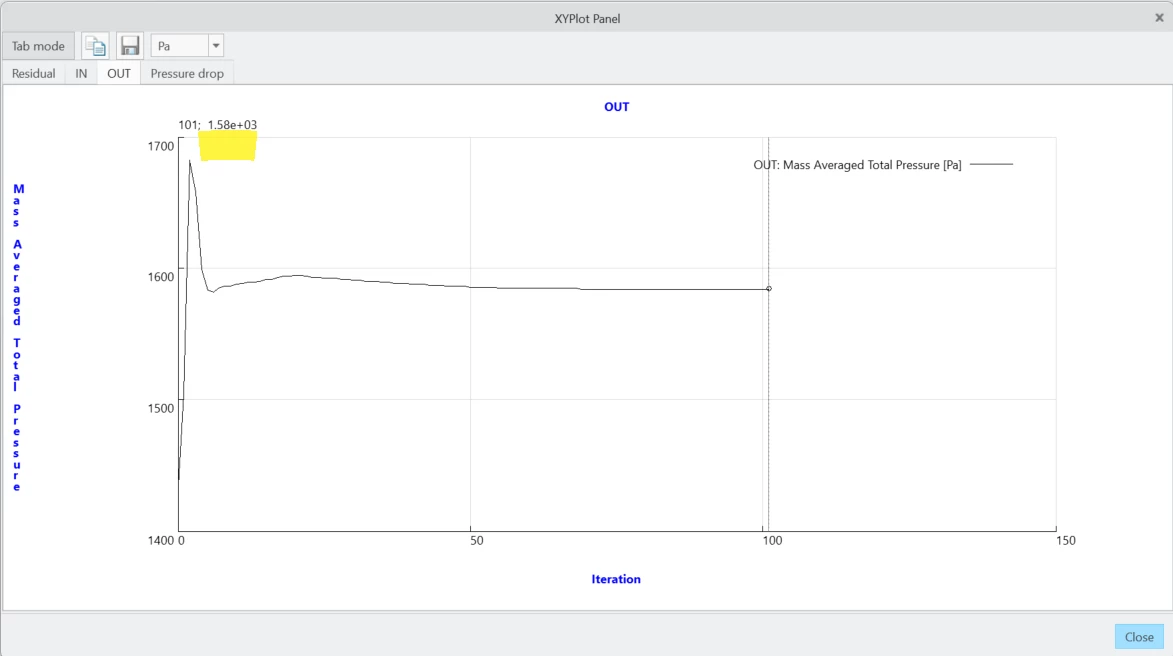
Also, does anyone know how to change the XY plot number format, marked in yellow below, from scientific notation to decimal format without having to export the graph data to a separate file and read it from there? I’m fairly sure this was a default in Creo 10.
Attaching the simulation report as well named “Pipe_eval.pdf”.