17-Peridot
February 19, 2016
Solved

2D to 3D

  • February 19, 2016
  • 4 replies
  • 2835 views

Hello folks,

does anybody know how to turn this oiecewise defined graph into a 3D plot?

Thanks in advance

Raiko

Best answer by ValeryOchkov

4 replies

24-Ruby IV
February 19, 2016

24-Ruby IV
February 19, 2016

25-Diamond I
February 19, 2016

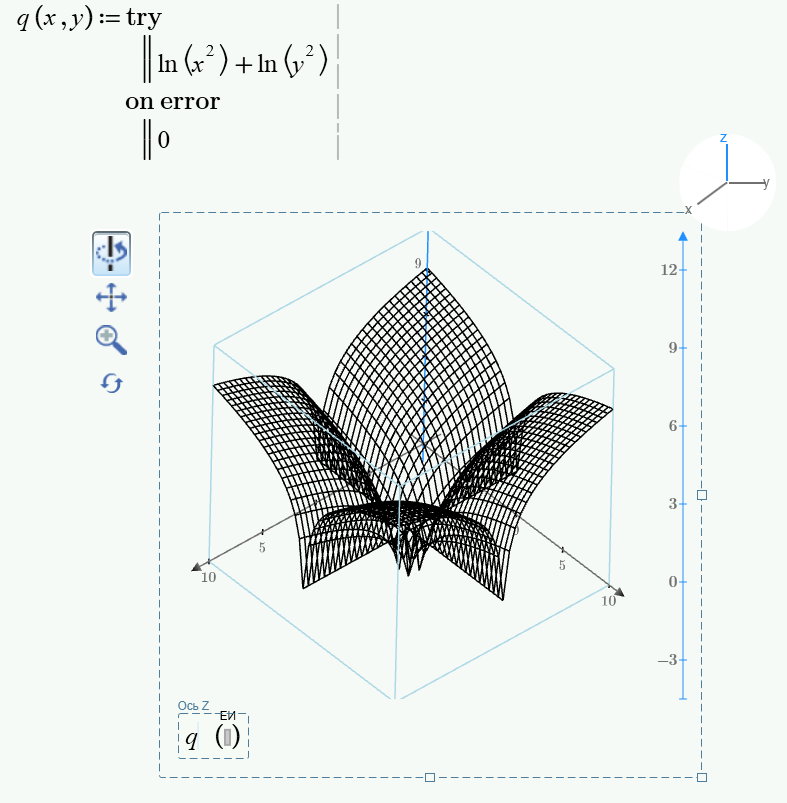
In Mathcad 15 you could use onerror similiar to what Valery had shown, but I would not return 0 in case of an error but rather a value like -10^(-8).

In Prime I would return NaN in case of error (unfortunately Mathcad 15 does not accept NaN in 3D plots).

You may also consider to simply chose a mesh which avoids zero values for x or y:

Regards

Werner

25-Diamond I
February 19, 2016

> To display one function is simple, but how do I define two consecutive functions that can be displayed in one 3D graph? f(x) and h(x) in my instance.

??? Sorry, but I don't understand what you are looking for.

> does anybody know how to turn this oiecewise defined graph into a 3D plot?

How would you like to plot a function fx)  in one independend variable (piecewise or not) into a 3D??

Fred had rotated your piciewise function around the z-axis.

I did something similar to what you tried with q(x,y)

WE

25-Diamond I
February 19, 2016

Oh,  just now noticed that you tried to define a function M further down.

You defined local functions M instead of assigning the result a local variable M (you may chose any other name here).

Furthermore your condition was faulty. You cannot write "(x AND y)>1" but have to write "x>1 AND y>1". At least I guess that this is what you had in mind.

But your logic seems to be faulty - I guess you had something different in mind that what you get here.

Just image where in the xy-plane the points are, where both x and y are either >1 or both are <1!

Werner

Raiko17-PeridotAuthor
17-Peridot
February 23, 2016

Thank you all for helping

Raiko