14-Alexandrite
September 10, 2020
Solved

3D plot of function in 3 variables

  • September 10, 2020
  • 2 replies
  • 4478 views

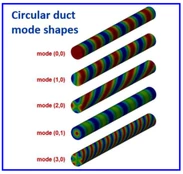
I am trying to plot the acoustic mode shapes inside a cylindrical pipe. The equation is in cylindrical coordinates in attached Mathcad file. Any assistance would be appreciated.. Thanks Ross 
Pipe acoustic mode shapes.png

Best answer by remslie

Valery, Thanks for your interest and support. You certainly have some mathematical horsepower in your Team

Cheers

Ross

2 replies

24-Ruby IV
September 10, 2020

If we want to plot the plot a function of 3 arguments we must fix the value of the one argument and the plot the 3D-plot of the function of 2 arguments. Or fix values of 2 fhgument and plot the 2D-plot of the function of one argument.

See please

Tomography 

21-Topaz II
September 12, 2020

Hi,

taking a cue from the file indicated by Valery Ockov, I tried to do the same things with Mathcad 15 albeit in a rudimentary way, see photo:

answer to remslie 1.jpg

24-Ruby IV
September 12, 2020

Welcome to my students team!

21-Topaz II
September 12, 2020

Hi,

me among your students?!?! as a - male single over seventy - , I would lose myself next to your female students ...
