15-Moonstone
Feb 6, 2015 12:31 AM UTC
Solved

3D Plots

I am trying to learn to make 3D plots and got stuck immediately on a simple example - see attached worksheet. Can someone help me get started? More generally, is there a better resource than the MC quicksheet, which I found to be minimally helpful?

Thanks.

Werner_E
Werner_EAnswer
25-Diamond I
Feb 7, 2015 3:39 AM UTC

Glad you got what you were hunting for.

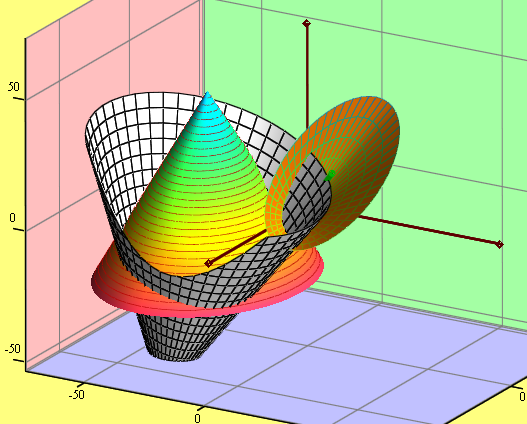
Here is a more generic routine to generate a cone along with an animation to explain the arguments of the function.

1.png

10 replies

19-Tanzanite
Feb 6, 2015 1:59 AM UTC

In your first plot there is no easy way to make the edge circular. However, other than a small detail, you got it in the second plot. It you put F1, F2, F3 in the placeholder then Mathcad interprets that as three plots, where the the z values are given by F1, F2, and F3, and the x and y values are the points on a rectangular x-y grid, determined by the quickplot parameters. If you replace that with (F1, F2, F3) Mathcad interprets that as a single plot where the x, y, and z values are given by F1, F2, and F3. Then you will see what you are looking for.

Translate
Werner_E
25-Diamond I
Feb 6, 2015 2:13 AM UTC

John Rudnicki wrote:

I am trying to learn to make 3D plots and got stuck immediately on a simple example - see attached worksheet. Can someone help me get started? More generally, is there a better resource than the MC quicksheet, which I found to be minimally helpful?

Usually I have found the help pages of Mathcad in addition with the quicksheets very helpful and quite comprehensive. Maybe its a good idea to work through all the examples first and then try something on your own.

In the first plot you can uncheck Auto Scale for the z-axis and set an appropriate value for the minimum and maximum value of z to get the circular edge you want to see.

You may find it more useful to create a vector function and use CreateMesh() for more flexibility and less need to change parameters like the grid size in the format menu.

The attached file should help.

Translate
19-Tanzanite
Feb 6, 2015 3:05 AM UTC
In the first plot you can uncheck Auto Scale for the z-axis and set an appropriate value for the minimum and maximum value of z to get the circular edge you want to see.

OK, OK. So there is an easy way to get a circular edge on the first plot . In my defense, I never use the 3D quickplot (or, for that matter, the 2D quickplot) for anything. They are more trouble than they are worth.

Translate
Werner_E
25-Diamond I
Feb 6, 2015 10:13 AM UTC

Richard Jackson wrote:

In the first plot you can uncheck Auto Scale for the z-axis and set an appropriate value for the minimum and maximum value of z to get the circular edge you want to see.

OK, OK. So there is an easy way to get a circular edge on the first plot . In my defense, I never use the 3D quickplot (or, for that matter, the 2D quickplot) for anything. They are more trouble than they are worth.

I also wouldn't recommend doing so and prefer the parametric representation of the cone in combination with CreateMesh.

Translate