

1-Visitor
January 30, 2015
Solved

3D Scatter Plot with Natural Log Element MathCAD 14

  • January 30, 2015
  • 6 replies
  • 3883 views

In MathCAD 14, I am having trouble making a 3D scatter plot when the matrix-function contains an element that is a natural log function. The same matrix-function plots OK If I substitute and different function for the natural log function. I have included an example file; why does the p.2xyz function plot OK and p.1xyz not plot at all?
Best answer by Werner_E

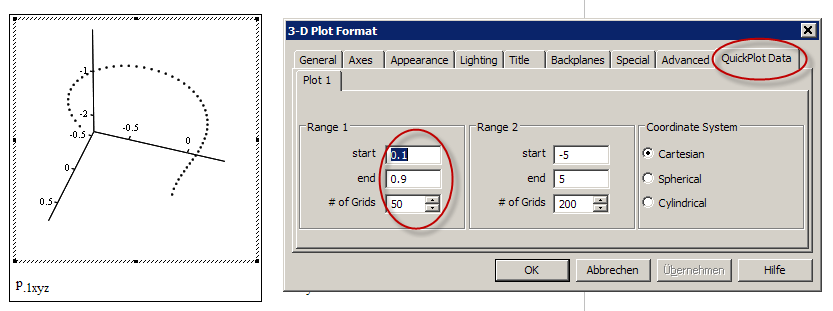
Unlike a 2D-plot a 3D plot will not respect and use your range t. So you used the 3D quickplot and it defaults to a range from -5 to 5. Give it a try, change your t-range and watch your second plot - nothing will happen.

The negative values in the range [-5; 5] throw a complex result, 0 makes the log function fail. Unlike a 2D plot a 3D plot fails if just one result is complex or NaN or the like.

To make your plot work you have to edit the quickplot range accordingly:

1.png

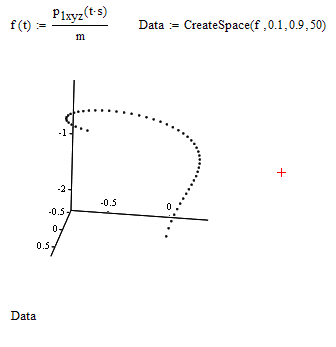
It may be more convenient to use the CreateSpace() function at the price of having to get rid of the units (which you should do in a 3D-plot anyway):

2.png

6 replies

ebrady-21-VisitorAuthor
1-Visitor
January 30, 2015

correction: "substitute a dirfferent" not "substitute and dirfferent"

Werner_E
25-Diamond I
January 30, 2015

Erroll Brady wrote:

correction: "substitute a dirfferent" not "substitute and dirfferent"

Even better "substitute a different", I guess.

BTW, as long as nobody has replied to a post of yours, you can still edit it. If its the initial post you find the option to do so in the outer right column, otherwise at the end of the posting.

ebrady-21-VisitorAuthor
1-Visitor
February 2, 2015

Yes. I suffer from doofus-finger.

Thanks.

Werner_E
Werner_E25-Diamond IAnswer
25-Diamond I
January 30, 2015

Unlike a 2D-plot a 3D plot will not respect and use your range t. So you used the 3D quickplot and it defaults to a range from -5 to 5. Give it a try, change your t-range and watch your second plot - nothing will happen.

The negative values in the range [-5; 5] throw a complex result, 0 makes the log function fail. Unlike a 2D plot a 3D plot fails if just one result is complex or NaN or the like.

To make your plot work you have to edit the quickplot range accordingly:

1.png

It may be more convenient to use the CreateSpace() function at the price of having to get rid of the units (which you should do in a 3D-plot anyway):

2.png

ebrady-21-VisitorAuthor
1-Visitor
February 2, 2015

Thank you,

That did the trick.

Erroll