1-Visitor
Apr 13, 2020 10:04 AM UTC
Question

Bode Diagram Plot

Hi, 

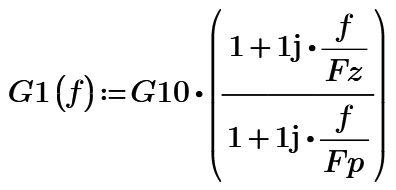
I am at my first steps with Mathcad, could someone help me to plot the bode diagram of the function G(f) pease

ML2_0-1586771800113.png

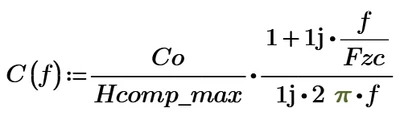
Where 

ML2_1-1586771858239.png

and 

ML2_2-1586771887754.png

Thanks


ML

11 replies

23-Emerald V
Apr 13, 2020 10:13 AM UTC

Please first enter your formulae onto a Mathcad worksheet and attach that worksheet to your posting.


Success!

Luc

Translate
21-Topaz II
Apr 13, 2020 10:19 AM UTC

Hi,

I randomly established the values of the constants.

answer to ML2.jpg

Translate
ML21-VisitorAuthor
1-Visitor
Apr 13, 2020 11:46 AM UTC

Thanks for your answer but could you please explain how did you get the definition of the frequency range ; and some steps to plot the diagram as you did.

thank you,

Regards.


ML

Translate
21-Topaz II
Apr 13, 2020 12:23 PM UTC

You can define the frequency range taking as minimum frequency the smallest value among the absolute values of the poles and zeros and as maximum value of the frequency range, the maximum value among the absolute values of the poles and zeros. The step amplitude can be defined dividing the difference of the previous values by the number of steps. I have considered as a minimum value of the frequency Fz divided by a thousand and as a maximum value, Fp multiplied by one hundred. To have a larger diagram you can replace a thousand with ten thousand and one hundred with a thousand or ten thousand or even more, that is, they are chosen according to your needs.

Translate