1-Visitor
October 27, 2015
Solved

Bode Plot from given Transfer Function in Mathcad Prime 13.0

  • October 27, 2015
  • 24 replies
  • 15649 views

Hello Everyone

I am new in Mathcad. I would like to plot "Bode Plot" from the given transfer function. I followed one of the attached reference ,but i stucked in between. Please help in this regard.

Please tell me if any other simplest way exist to do so.

fs.png

Best answer by StuartBruff

AlvaroDíaz wrote:

Sorry, can't tell you why, but I only rewrite your expressions, and then works. But have not idea why.

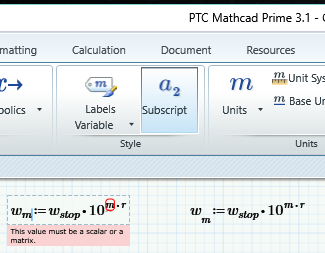
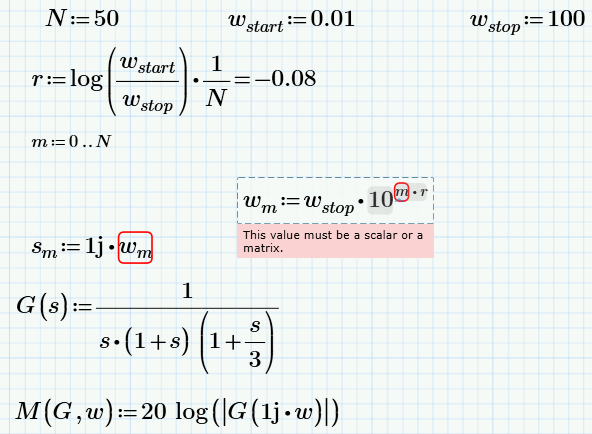
It's a sneaky one, Alvaro; one of the commonest errors that can't be easily diagnosed from a picture and needs a careful look even with a worksheet.   sm is a literal subscript not an index.  Note how the "Subscript" button highlights in the Style ribbon.  The definition on the right has m as a vector index; it is slightly lower than the literal version of m but not sufficiently to make it clear.   I'm not sure that it's worth the effort of lowering the index (given that the Subscript button highlights) ; I prefer the look of the literal subscript position anyway - it's just one more ambiguity in standard math notation and I'd prefer Mathcad (and other applications) to stick to the ISO (or, at least, have an option for strict ISO)..
Stuart

24 replies

12-Amethyst
October 27, 2015

Sorry, can't tell you why, but I only rewrite your expressions, and then works. But have not idea why. Hope that the attached works in your computer.

Regards.

23-Emerald V
October 27, 2015

AlvaroDíaz wrote:

Sorry, can't tell you why, but I only rewrite your expressions, and then works. But have not idea why.

It's a sneaky one, Alvaro; one of the commonest errors that can't be easily diagnosed from a picture and needs a careful look even with a worksheet.   sm is a literal subscript not an index.  Note how the "Subscript" button highlights in the Style ribbon.  The definition on the right has m as a vector index; it is slightly lower than the literal version of m but not sufficiently to make it clear.   I'm not sure that it's worth the effort of lowering the index (given that the Subscript button highlights) ; I prefer the look of the literal subscript position anyway - it's just one more ambiguity in standard math notation and I'd prefer Mathcad (and other applications) to stick to the ISO (or, at least, have an option for strict ISO)..

Stuart
12-Amethyst
October 27, 2015

Wow. With Prime I feel like working with a hammer for clean glasses. I check if was that but can't found any visual difference when editing. And, I like the rubber minimized. MC6 have more options than prime.

21-Topaz II
October 27, 2015

    Hello, Sgarg! regard to the "Nichols Chart" you could download the worksheet (Nichols Chart.xmcd) present on the second page of this community and try to import it into "PRIME 3.1". Success is not assured.

23-Emerald IV
October 27, 2015

Ah,

and all I see is that you appear/seem to be working with a version of Prime that I guess even PTC is only dreaming of......13.

Luc

1-Visitor
October 27, 2015

sgarg1-VisitorAuthor
1-Visitor
October 27, 2015

Hello Everyone

I have been through all suggestions. On that example it was working find but attached example its not working and again some error is coming. Please help me in this regard.<<Please see attached Problem1>>

Also I would like to make w_start and w_stop with Hz as a unit. When i used to  do so i was getting an error.<<Please see attached problem2>>

23-Emerald V
October 28, 2015

SAMEER GARG wrote:

Hello Everyone

I have been through all suggestions. On that example it was working find but attached example its not working and again some error is coming. Please help me in this regard.<<Please see attached Problem1>>

Problem 1 is actually corrected by adding units to wstart and wstop.

Just as an aside, whilst the wm method works well in Mathcad, it might be slightly less meaningful to an average (but domain-literate) reader.  It would be nicer to drop the indices and just have M(g,w) and w on the axes.  You can achieve this by making M and P automatically vectorize their arguments.

Also I would like to make w_start and w_stop with Hz as a unit. When i used to  do so i was getting an error.<<Please see attached problem2>>

Your new expression for G(s) contains a polynomial in s, which when expanded will result in an equation that has mixed powers of Hz.  Dimensionally, this is disallowed as you cannot add seconds to seconds-squared.    There are several ways of dealing with this: divide s by Hz when calling the G, divide s by Hz inside G and then apply the expression , divide each s in the expression by Hz, or expand the polynomial and divide each power of s by the appropriate power of Hz.  See the attached worksheet.

Stuart

sgarg1-VisitorAuthor
1-Visitor
October 29, 2015

Hi

Thanks a lot for valuable response. As per your suggestion i used to call the function from the plot with taking care of dimension. In lott of problem it worked fine but i am unable to proceed for given transfer function. Please help what exactly I have to do, @to take care of?

21-Topaz II
October 28, 2015

Hello Sameer!

I also use for the first time mathcad PRIME 3.1.

I would solve your problem as shown in the attached file.