19-Tanzanite
October 14, 2022
Solved

Bode Plot - NaN/Complex values Error and Plot Grid Does Not Exist in Mathcad Prime 7

  • October 14, 2022
  • 1 reply
  • 8135 views

Hello,

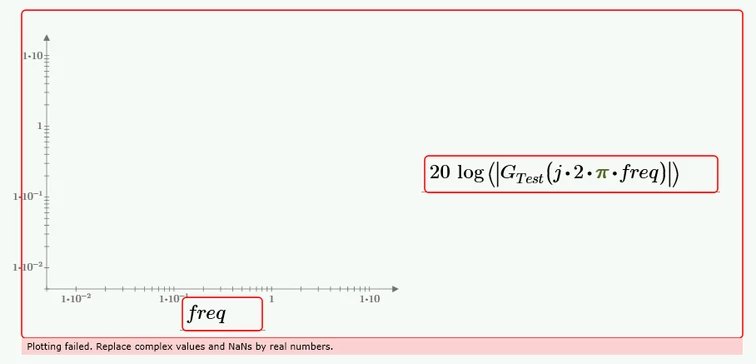
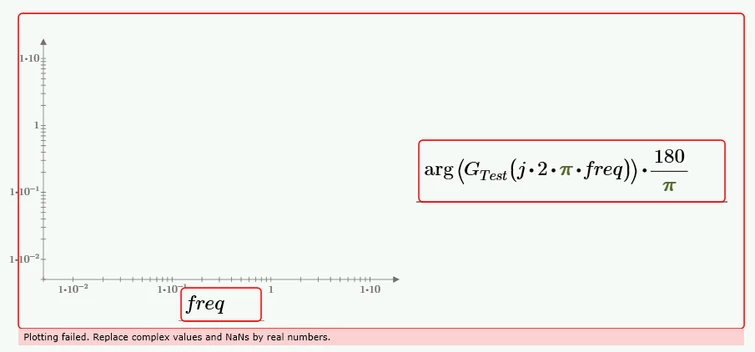
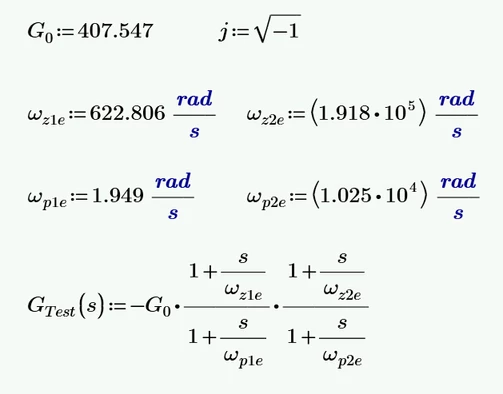
How can I get rid of that error in red below? I want to plot the Bode graphs of amplitude-frequency and phase-frequency in Mathcad Prime 7.

Also, I want to have grid on in these graphs. How can I do that in Mathcad Prime 7?
 

CornelBejan_0-1665740134495.png

CornelBejan_10-1665741063475.png


CornelBejan_11-1665741075203.png


Mathcad Prime 7 file is attached.
Thank you.

Best answer by LucMeekes

You left freq undefined, so Prime will try to range freq from -10 to 10. Of course that doesn't work on a logarithmic scale. In addition freq needs a unit (Hz or so).

You can solve this problem simply by defining freq as:

LucMeekes_3-1665742849598.png

But this creates a lot of superfluous points for a log scale. And when you want to go over 6 decades it's not going to work.


You can use logpts() or logspace() to generate a vector of logarithmically spaced points for freq:

LucMeekes_0-1665742233144.png

To get 10 points per decade from 10^0(=1) to 10^3(=1000) Hz.

Now you need to vectorise the plot expressions.

You can use the unit deg instead of multiplying the argument with 180/pi, and i is a predefined constant, you don't need to define j.

This gets:

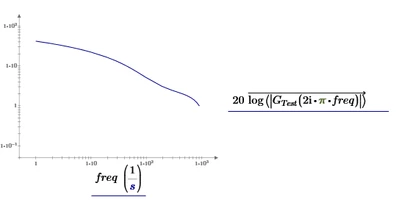
LucMeekes_1-1665742399789.png

and

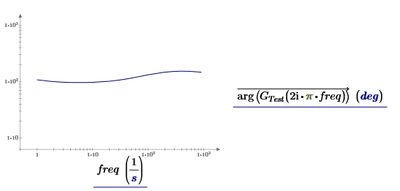
LucMeekes_2-1665742420719.png

Success!
Luc

1 reply

LucMeekes23-Emerald IVAnswer
23-Emerald IV
October 14, 2022

You left freq undefined, so Prime will try to range freq from -10 to 10. Of course that doesn't work on a logarithmic scale. In addition freq needs a unit (Hz or so).

You can solve this problem simply by defining freq as:

LucMeekes_3-1665742849598.png

But this creates a lot of superfluous points for a log scale. And when you want to go over 6 decades it's not going to work.


You can use logpts() or logspace() to generate a vector of logarithmically spaced points for freq:

LucMeekes_0-1665742233144.png

To get 10 points per decade from 10^0(=1) to 10^3(=1000) Hz.

Now you need to vectorise the plot expressions.

You can use the unit deg instead of multiplying the argument with 180/pi, and i is a predefined constant, you don't need to define j.

This gets:

LucMeekes_1-1665742399789.png

and

LucMeekes_2-1665742420719.png

Success!
Luc

Cornel19-TanzaniteAuthor
19-Tanzanite
October 14, 2022

It is a little strange because if I do not put the units (meaning rad/s) for wze1, wze2, wpe1, wpe2 then 1) I do not need to define any freq, 2) I do not need to vectorize anything and 3) the graphs are displayed. Do you know an explanation for this thing?


CornelBejan_1-1665746884963.png


CornelBejan_2-1665746927570.png


CornelBejan_5-1665746965287.png


And do you know how to put grid on the graphs in Mathcad Prime 7?  Can you tell me how to do this?
Grid like:

BodePaper2.gif

Thank you.


23-Emerald IV
October 14, 2022

The native plot function of Prime does not provide for Grids. But you can make your own.

Attached sheet contains a utility.


The reason that the plot works when you strip all units, is because freq, if undefined, gets an automatic range but without units. (The automatic range is -10 to 10 for linear scales, and appears to be 0.4 to 10 for log scales.)

Having units in your omega's but not in your s's causes inconsistent units in the transfer function Gtest, where you add 1 (no units) to s/omega, and only omega has a unit. You're trying to add apples to pears...


Success!
Luc