15-Moonstone
July 21, 2022
Solved

Contour plot. Level Curve

  • July 21, 2022
  • 1 reply
  • 2673 views

Hello.


I was trying to plot some level curves by using contour plot command (see attached file).


When I define some variable "C", the plot works fine. But when I assign a range to the "C", the level curves fails to plot.


Why the plotting fails?


Best regards,

Sergey



Best answer by Werner_E

If C should be the level then C its NOT part of the function term, but its rather the curve resulting from the implicit function f(x,y)=C.

Which function f?

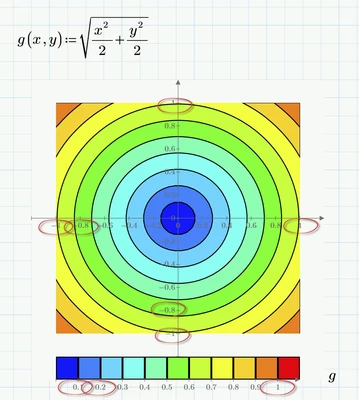
A single  contour plot of f should shou you a couple of level curves and you can control how many and at which space by editing the first, second and last value of the legend below the plot (its rather clumsy to do).

In the pic below I highlighted the values you can edit to achieve the desired effect. Prime sure makes it unnecessary complicated to get a certain number of contour lines.

Werner_E_0-1658409788208.png

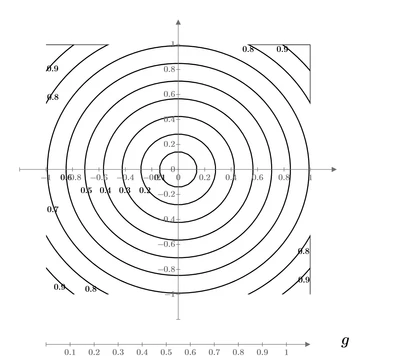
You can also turn off the color scheme and turn on the level values

Werner_E_0-1658409923841.png


1 reply

25-Diamond I
July 21, 2022

C is just the offset of the parabola in y direction. Its not the level/height (in case you thought it is).

I am not sure what kind of plot you expected. The contour plots of 10 different surfaces one on top of the other??

On the other hand - your second plot is a simple xy-plot and you try to plot a function z=f(x,y). Apart from the range C - what result did you expect?

Sergey15-MoonstoneAuthor
15-Moonstone
July 21, 2022

It is indeed a family of the level curves as shown in picture below. 

Sergey_0-1658408640823.png


Werner_E25-Diamond IAnswer
25-Diamond I
July 21, 2022

If C should be the level then C its NOT part of the function term, but its rather the curve resulting from the implicit function f(x,y)=C.

Which function f?

A single  contour plot of f should shou you a couple of level curves and you can control how many and at which space by editing the first, second and last value of the legend below the plot (its rather clumsy to do).

In the pic below I highlighted the values you can edit to achieve the desired effect. Prime sure makes it unnecessary complicated to get a certain number of contour lines.

Werner_E_0-1658409788208.png

You can also turn off the color scheme and turn on the level values

Werner_E_0-1658409923841.png