1-Visitor
January 28, 2016
Solved

Curve fitting using a numerically-solved equation

  • January 28, 2016
  • 12 replies
  • 4948 views

Dear all,

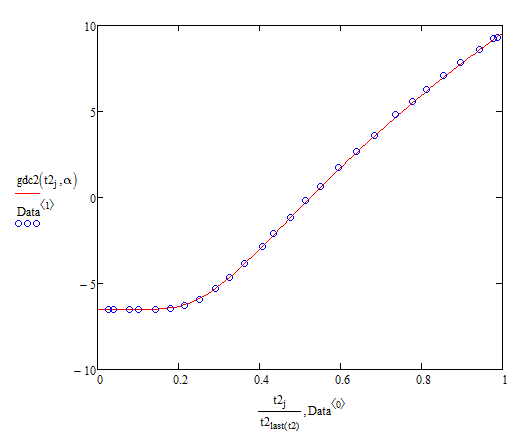
I attach here a numerically-solved equation code for you. The tuning parameter in the code is alpha (alpha:=2.4/1.764). What I usually did for my work is to choose different alpha values and to generate the data of gdc vs. t/t_1618. I compare the generated curve to my experimental data and I justify the correct alpha values by naked eyes. Is it possible to modify my code to import the experimental data and let the Mathcad find the alpha value from a least-square fitting?

I really have no idea how I should do that. Could anyone give me some help please?

With best regards,

Chien-Lung Huang

Best answer by RichardJ

Well, that was more trouble than I expected. There are some numerical issues that had to be dealt with, and when I was almost done Mathcad crashed during a file save, and wiped out everything (the zero byte file problem) . Here it is though.

12 replies

23-Emerald I
January 28, 2016

I can't find any data in your file, and I'm having trouble seeing what function you're trying to fit.

Mathcad has a wide selection of curve-fitting functions, the Help menu is a great place to start.

19-Tanzanite
January 28, 2016

What you want is possible (not even that difficult, in fact), but we need the data.

chuang-41-VisitorAuthor
1-Visitor
January 29, 2016

Please take the following data to fit.

t/t1618    gdc

0.027470231878003    -6.5181281618887

0.0398788385209944    -6.5181281618887

0.0783580530603719    -6.5181281618887

0.101796532274911    -6.5181281618887

0.144411949028619    -6.5181281618887

0.18025903488615    -6.45938729623384

0.215980781282641    -6.25379426644182

0.251827867140171    -5.90134907251265

0.290307081679549    -5.28456998313659

0.32615416753708    -4.67046093310849

0.36187591393357    -3.84808881394042

0.407248798830165    -2.82279370432828

0.433444746187591    -2.11790331646993

0.476060162941299    -1.15134907251265

0.514664716941717    -0.182124789207421

0.550386463338208    0.637577290612702

0.595759348234803    1.75098369870714

0.638500104449551    2.6614671163575

0.683872989346146    3.62802136031478

0.736139544599958    4.80283867341203

0.778880300814707    5.56379988757729

0.81184457906831    6.26869027543564

0.854585335283058    7.08839235525576

0.897200752036766    7.85202360876897

0.942573636933361    8.61298482293423

0.978420722790892    9.22976391231028

0.987946521829956    9.28850477796515

As you could see from the plot in the attached code, very close to t/t_1618 gdc turns down rapidly. You could ignore the fit to this region. Thank you for the prompt help.

WIth best regards,

Chien-Lung Huang

24-Ruby IV
January 29, 2016

Please find in attachment some model that describe your experimental data. To find the coefficients of the equation, I used the built-in function "genfit()".