The data structure you provide is just a list of points, but not a mesh of a surface.
I always wondered which surface Mathcad creates when given just a bunch of points and asked to do a surface plot. Obviously it creates a surface and, obviously, too, not the surface you are looking for.
You don't have to create the needed data strucure yourself - you can use CreateMesh to do it for you (as already shown in my first answer here). As it seemed to me the you would like to see degrees and not radians in your plot and as we cannot divide the variables by the unit we want to see as we can do in a 2D.plot, I created an auxiliaray function III() which takes unitless values and adds the degree factor before handing it over to the function I(). You may use *deg instead of the degree sign I used.
You may change the number of contours in the "special" tab of the 3D.plot format menu.
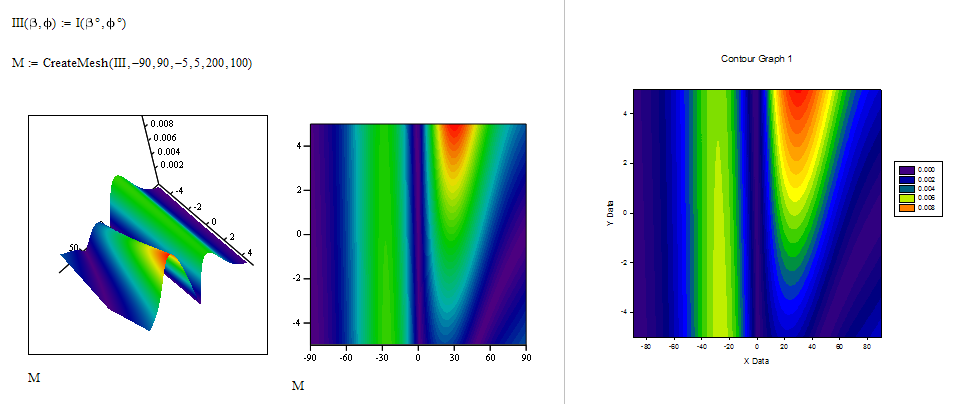
PS: I just see you already created a correct contour plot at the end of your file. But you see the angles in radians and you forgot to set "fill contours" in the "Appearance" tab of the 3d-plot format menu. As already written you can change the number of contour lines, number them, chose the colormap used ("Advanced" tab), etc. Sigmaplot used a different color map, therefor the difference in color appearance. You may create and provide your own colormaps in Mathcad if you are willing to spend the time doing so.
Unfortunately Mathcad 15 provides no easy way to add a legend.



