


1-Visitor
July 28, 2016
Solved

Do we have the control of the curves showing in the plot if we only want to display the curve partially?

  • July 28, 2016
  • 3 replies
  • 1410 views

Hi All, I have a question about the curve plot. Attached is an example I want to ask. Can we have the control of the curve in the plot, by only letting it show in a specific range? We can do it in the math function, by including some conditional setup. But if we do not do the conditional setup, can we still place the limitation in the curve plot?

Best answer by Werner_E

Why don't you like conditions in the function definition?

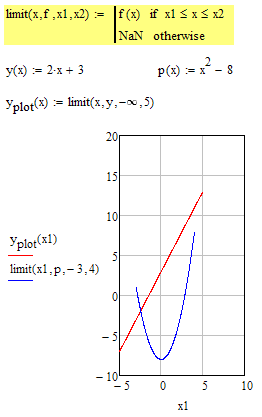
If the reason is that you later need the function for calculation in a wider range, you may consider to define an extra function for plotting- Maybe even using an utility function which limits the range the function returns values:
3 replies

21-Topaz II
July 28, 2016

yhuang_3.jpg

19-Tanzanite
July 28, 2016

Define a range variable above the plot, then click on the plot and type 10 into the placeholder for the upper limit on the x-axis and 30 into the placeholder for the upper limit on the y-axis

Werner_E25-Diamond IAnswer
25-Diamond I
July 28, 2016

Why don't you like conditions in the function definition?

If the reason is that you later need the function for calculation in a wider range, you may consider to define an extra function for plotting- Maybe even using an utility function which limits the range the function returns values: