

16-Pearl
June 23, 2016
Solved

Equations for iso-lines (Larson-Miller constant)

  • June 23, 2016
  • 6 replies
  • 8227 views

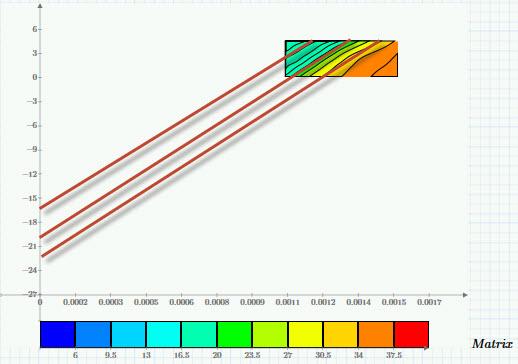
Hi all.  Here's my question.  I would like to be able to line fit an iso-line.  Mathcad clearly can generate the data for the iso-line since it plots it on a contour plot.  Is there a way to get the coordinates of the iso-line so that I can fit it to calculate the y-intercept? Or maybe there's a completely different way to solve this problem.  Attached is the Prime 3.1 file and pdf that will explain what I'm after more clearly.

Basically I'm trying to generate the red lines I've overlaid here (with a paint program)
Lines.jpg

Best answer by DJF

I combined parts from Fred's and Richard's solutions to create my 'final' worksheet (attached).  I appreciate all the help; I certainly learned a few tricks with this one.

Thanks again.

6 replies

19-Tanzanite
June 23, 2016

Sorry, I can't open a 3.1 file. Assuming you are starting with data, you need to fit the data with a surface to get a function. I don't know anything about your data, so it's hard to suggest a function. Spline interpolation will always work, but is not necessarily the best choice. Then use a solve block to find the y value for given values of x and z.

24-Ruby III
June 24, 2016

Richard,

PDF is included in archive file from above.

23-Emerald V
June 23, 2016

dferry wrote:

Hi all.  Here's my question.  I would like to be able to line fit an iso-line.  Mathcad clearly can generate the data for the iso-line since it plots it on a contour plot.  Is there a way to get the coordinates of the iso-line so that I can fit it to calculate the y-intercept? Or maybe there's a completely different way to solve this problem.  Attached is the Prime 3.1 file and pdf that will explain what I'm after more clearly.

Basically I'm trying to generate the red lines I've overlaid here (with a paint program)

Unfortunately, Mathcad doesn't actually generate the isolines.  This is a function of the plotting 'component' and the values are private (there is a long, long, long standing feature request to make this information available from the plot).

However, Mathcad has a few ways of generating the isolines, the complexity of which will depend upon the nature of your function.   As it looks fairly simple from the image, I'lll give an example of two methods (in Mathcad 15, but should port to Prime) using the root function and a solve block.

Stuart

23-Emerald V
June 23, 2016

StuartBruff wrote:


Unfortunately, Mathcad doesn't actually generate the isolines.  This is a function of the plotting 'component' and the values are private (there is a long, long, long standing feature request to make this information available from the plot).

However, Mathcad has a few ways of generating the isolines, the complexity of which will depend upon the nature of your function.   As it looks fairly simple from the image, I'lll give an example of two methods (in Mathcad 15, but should port to Prime) using the root function and a solve block.

Ignore the above ... I've just read your pdf and it's a different problem.

Stuart

19-Tanzanite
June 23, 2016

I didn't realize there was also a pdf until Stuart posted. Could you please post your data in an Excel spreadsheet.

DJF16-PearlAuthor
16-Pearl
June 23, 2016

Here's the raw data and the data converted into the "Matrix' used for plotting.

23-Emerald I
June 23, 2016
23-Emerald I
June 23, 2016

Mathcad can do a multivariant regression.

you can create a function that fits your data with "polyfit."

You can see the coefficients with "polyfitc."

Short example attached.  With this function, you should be able to extract C.

19-Tanzanite
June 23, 2016

I have just realized that what you are trying to do cannot work. You say "Larson-Miller considers that iso-stress lines intersect the y-axis at a constant point". However, to be able to extrapolate the isolines as straight lines to 1/T=0 (so T is infinite - seems strange to me) would require that the isolines are straight lines (or the points generated from them are in a straight line), which in turn means the surface is a plane. However, if the surface is a plane then the isolines are parallel, and will not meet at the y-axis (or anywhere else!). For isolines (i.e. contours) to intersect the gradient of the surface has to become infinite.

19-Tanzanite
June 23, 2016

Try this. I'll leave you to fit lines through the data sets. I don't need to do that to tell you that they will not intersect at the y-axis.

19-Tanzanite
June 23, 2016

I guess I couldn't resist

I suppose you could just take the average of the intersection values. Better than nothing perhaps.

DJF16-PearlAuthorAnswer
16-Pearl
June 27, 2016

I combined parts from Fred's and Richard's solutions to create my 'final' worksheet (attached).  I appreciate all the help; I certainly learned a few tricks with this one.

Thanks again.