
1-Visitor
November 23, 2015
Solved

Error: The function did not evaluate to a pure real value

  • November 23, 2015
  • 1 reply
  • 2639 views

I have tried plotting multiple 3D graphs, but keep getting the error: The function did not evaluate to a pure real value

Does anybody have a prober fix to this?

Best answer by Werner_E

This is a bit tricky as Mathcads 3D-plot is quite limited.

You can only plot over a rectangular area  of the xy-plane.

You can set the x- and y limits when you double click the plot to get into the plot format menu and then chose the tab "QuickPlot Data".

If you set eg Range1 to run from -10 to 0  and Range2 from 2 to 10 you will see a plot as all meshpoint evaluate to real values.

As you have seen, the whole plot fails even if just one single pair (x,y) evaluates to a non-real number or to NaN.

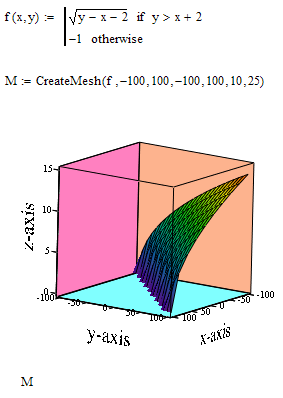
Another way round is to redefine your function to return a dummy value (-1 in my example) in case the value would get non-real.

Then I set the z-axis manually to go from 0 to whatever seems appropriate so the dummy values are hidden.

One other thing is to use CreateMesh. It gives you a better control over the x- and y-limits and you don't have to change them in the format menu.
1 reply

Werner_E25-Diamond IAnswer
25-Diamond I
November 23, 2015

This is a bit tricky as Mathcads 3D-plot is quite limited.

You can only plot over a rectangular area  of the xy-plane.

You can set the x- and y limits when you double click the plot to get into the plot format menu and then chose the tab "QuickPlot Data".

If you set eg Range1 to run from -10 to 0  and Range2 from 2 to 10 you will see a plot as all meshpoint evaluate to real values.

As you have seen, the whole plot fails even if just one single pair (x,y) evaluates to a non-real number or to NaN.

Another way round is to redefine your function to return a dummy value (-1 in my example) in case the value would get non-real.

Then I set the z-axis manually to go from 0 to whatever seems appropriate so the dummy values are hidden.

One other thing is to use CreateMesh. It gives you a better control over the x- and y-limits and you don't have to change them in the format menu.