

1-Visitor
April 20, 2017
Solved

Evalyating a Polynomial Graph

  • April 20, 2017
  • 12 replies
  • 4148 views

Hello,

Firstly, this is a feature of Mathcad I am exploring for the first time.

I am looking at a problem whereby I have a series of coordinates which I have used to plot a graph.

I now need to evaluate the graph in two ways. One I need to find what the largest value on the y value is and then the point at which the curve crosses the x axis (for the second time).

I can do this by eye and say that y is larges at ~0.52 and the curve crosses the x axis at ~84 degrees.

Is there a way to evaluate this mathematically to get a more accurate approximation?

Also can anyone tell me how I can increase the accuracy of the scales i.e. the points on the x axis of interest are currently 81 then 90. How can I show more points i.e. increments of 1 degree on the x axis?

Thanks,

Andy.
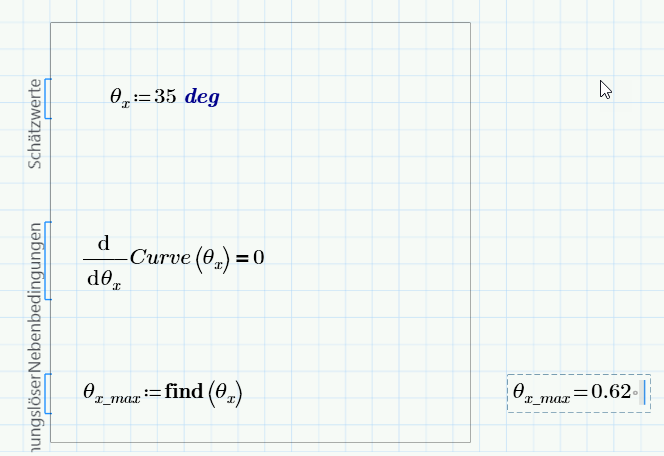
Best answer by vlehner

change the unit from Thetaxmax to °:

12 replies

1-Visitor
April 20, 2017

Hi Andy,

Answers see attachement.

Hope it will be helpful.

Best regards, Volker

awibroe1-VisitorAuthor
1-Visitor
April 20, 2017

Hi There,

I have Mathcad Prime 3 and it will not allow me to open the file because it is made from a later version. Is it possible to save it in a format I can open?

1-Visitor
April 20, 2017

Ah! I'm working in MCP4. So lets communicate via PDF-File.

1-Visitor
April 20, 2017

Klick the second number on the x-Achse and change it to e.g 5.

Mathcad takes the steps in5 steps up to 90.

see this:

awibroe1-VisitorAuthor
1-Visitor
April 20, 2017

I've looked through the PDF as I cant open the Mathcad file. I am clearly not doing something correctly as I get a different value to you?