24-Ruby IV
November 20, 2015
Solved

Finding curve

  • November 20, 2015
  • 10 replies
  • 5183 views

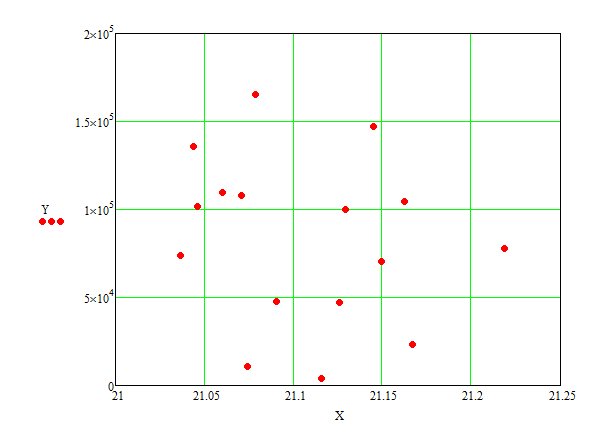
I want to approximate the experimental data by a curve as shown below on screenshot. I tried to use inverse probability density for the normal distribution, but without success. Are there any ideas in this regard (which equation can describe the data or maybe I need to create several sections/parts of the curve)?

Initial data:
Pic_1.png

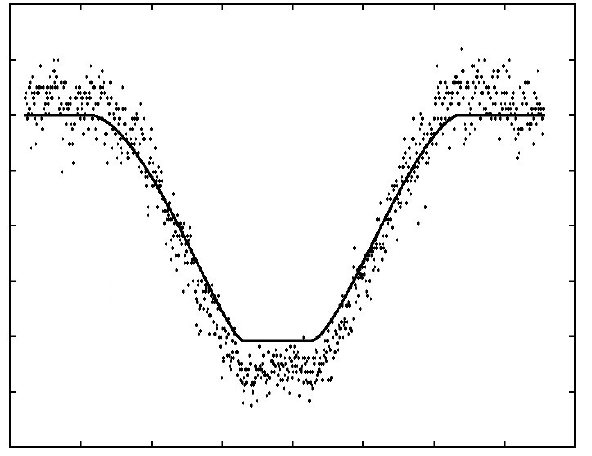
The approximating curve must have the following form:
Pic_3.png

Or this form:

Pic_2.png

Best answer by RichardJ

Do you mean putting the Y data on a log10 scale?

10 replies

19-Tanzanite
November 20, 2015

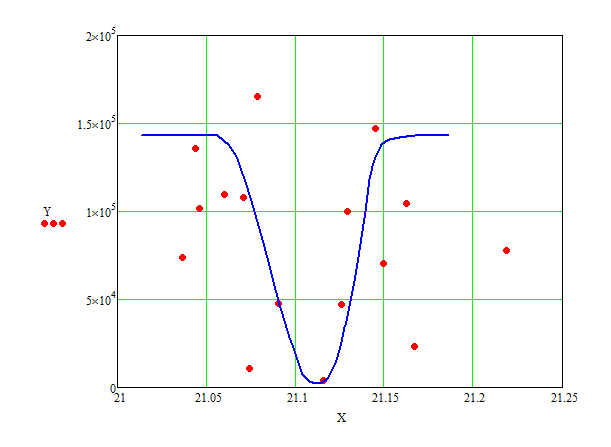
Here's one possibility. The data has so much error you are unlikely to get a curve that looks like what you want though. The fitted parameters will be pretty much meaningless too.

24-Ruby IV
November 20, 2015
23-Emerald I
November 20, 2015

Does the term "shotgun pattern" apply?  😉

VladimirN24-Ruby IVAuthor
24-Ruby IV
November 21, 2015

Absolutely .